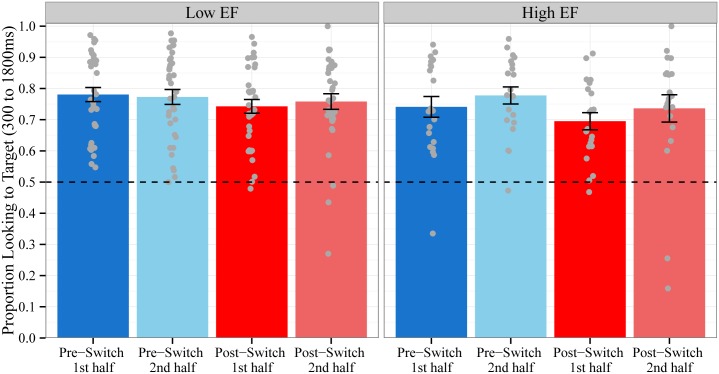
Fig 7. Mean Accuracy by Block Halves by EF.
Proportion of time spent looking to the target object out of the total time spent looking at both objects during the critical window for trials in the first and second half of the Pre-Switch and Post-Switch blocks. Children with low EF are plotted in the left panel and high EF in the right panel. Chance = 0.5. Data points represent the proportion for each subject averaged across trials. Error bars represent +/- 1 SE.

