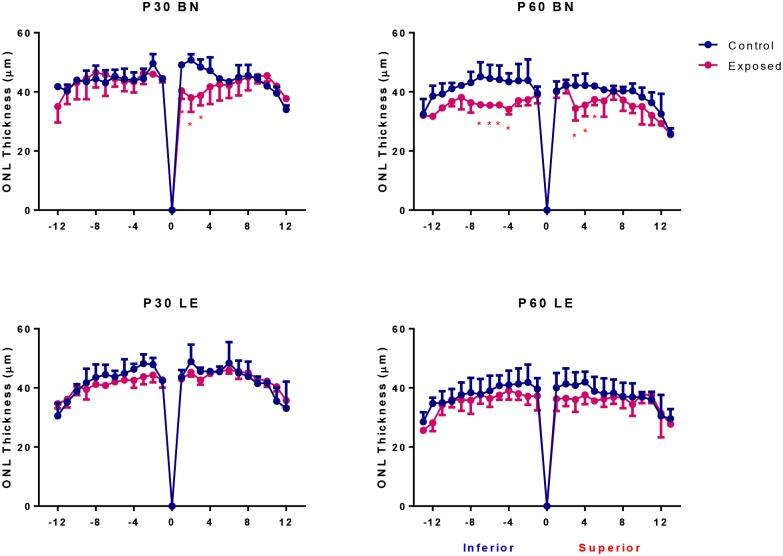
Fig 8. Spidergraph representation of ONL loss along the inferior (left) and superior (right) axis in control (blue) and light exposed (pink) BN and LE rats at P30 and P60.
Measurements were taken at every 340μm from the optic nerve head towards the ora serrate in both hemiretinas. Abbreviations: Optic nerve head (ONH), Brown Norway (BN) and Long Evans (LE).

