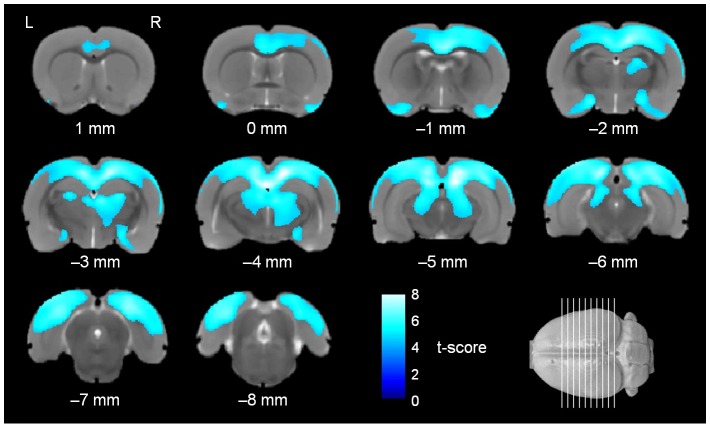
Fig 2. Regional volume decrease in the brain of rSey2/+ rats compared to WT rats.
Colored voxels represent clusters of significant regional volume decrease in the brain of rSey2/+ rats (n = 29) compared to WT rats (n = 31) in ANOVA (FWE, p < 0.05; threshold of 500 voxels) superimposed on the T2-weighted MRI template. rSey2/+, Pax6 heterozygous mutant; WT, wild-type; ANOVA; analysis of variance; FWE, family-wise error.

