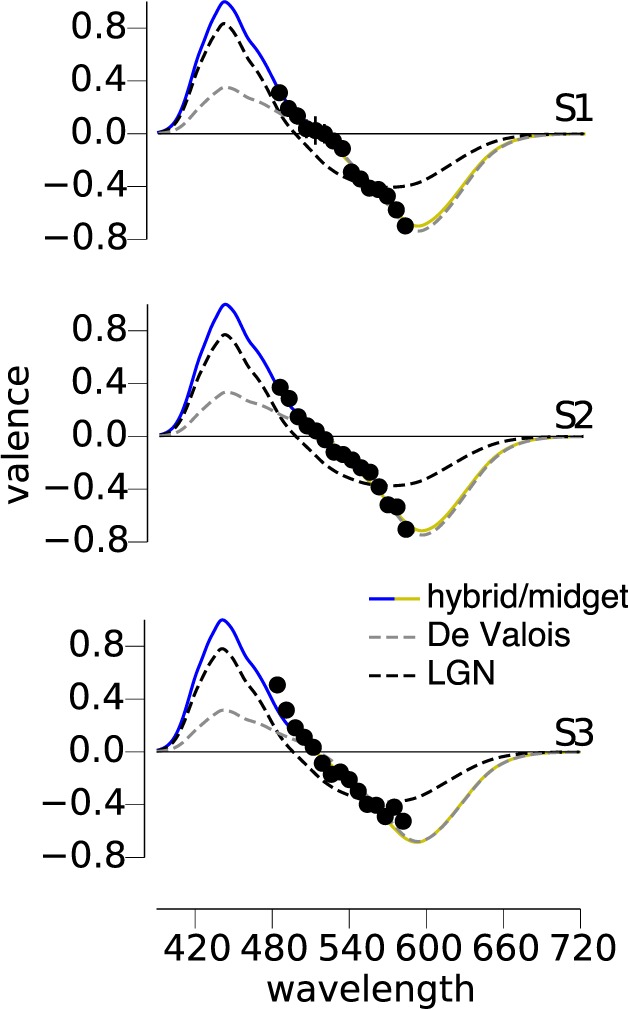
Figure 2.

Hue cancellation reveals M cones contribute to blue. Three subjects made hue cancellation settings for wavelengths between 484 and 582 nm at a luminance of 200 Td. The relative intensity of the cancellation necessary to eliminate the sensation of blue and yellow is plotted for each subject. Four models of BY opponency were fit to each subject's data. The gray dashed lines demonstrate the best-fit LGN (S – (L+M)) system. Black dashed lines represent the De Valois (S+M) – L mechanism, whereas the solid colored lines are an (S+M) – L model with a normalization process (hybrid and midget models produce identical fits). In each case, the BY system is best fit with a system summing S and M cones and incorporating a normalization mechanism to the mean environmental distribution.
