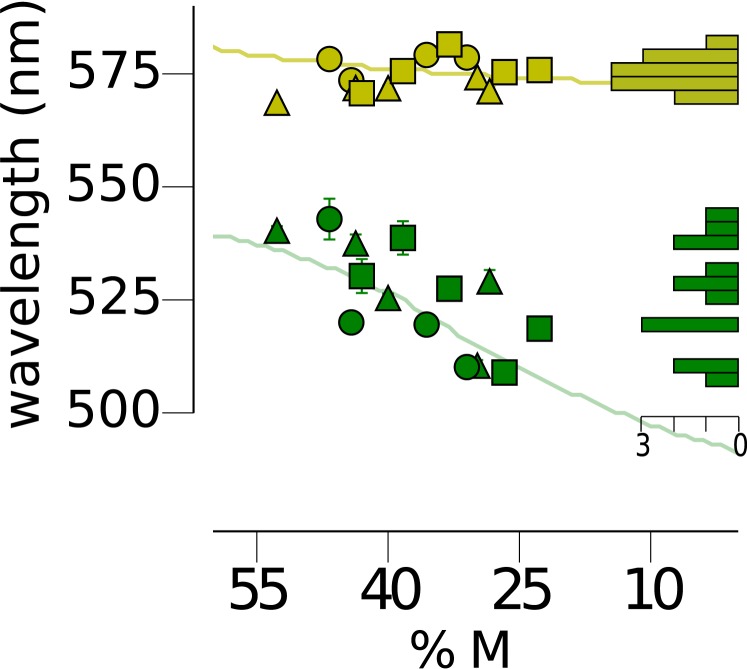
Figure 3.
The spectral locus of unique green is correlated with cone ratio as predicted by the midget ganglion cell model. The spectral position of unique green was determined for fourteen subjects. The unique green setting for each subject is represented by a green symbol. Filled circles are subjects with L cone λmax = 559 nm; squares are subjects with L cone λmax = 557.25 nm and triangles are subjects with L cone λmax = 555.5 nm. The abscissa denotes %M (M / (L + M) × 100). For comparison, unique yellow settings are shown in yellow for the same subjects. Filled circles, squares and triangles represent L cone λmax as above. The continuous lines are the predictions of the model that most accurately predicted our subjects' unique hue results which was the midget ganglion model (Figure 1D). The histograms on the right show the distribution of unique hue settings. Scale bar denotes number of subjects.

