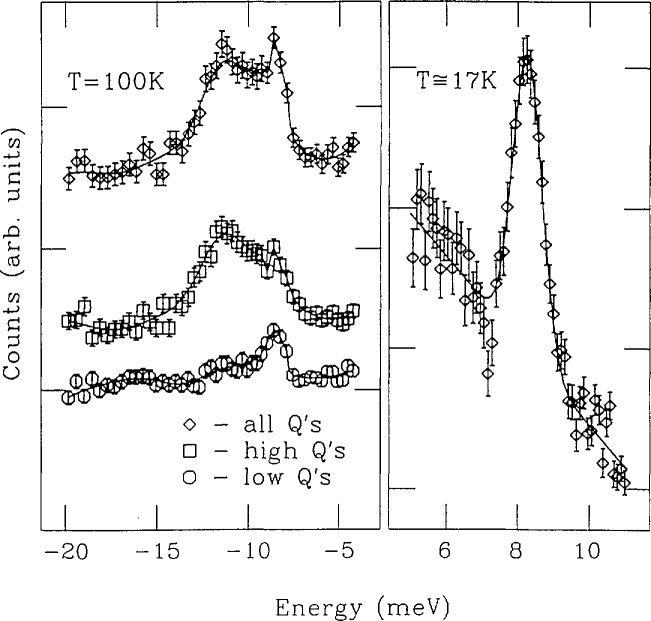
Fig. 5.
Examples of inelastic TOF spectra (E0=13.8 meV) for Zn0.94Co0.06S. The right panel shows the neutron energy-loss side of the spectrum obtained at 17 K with a fitted Gaussian line shape. The left panel shows energy-gain spectra at 100 K obtained by summing the counts from all detectors, from the “high-Q” detectors, and from the “low-Q” detectors. The curves are guides to the eye [15].

