Fig. 7.

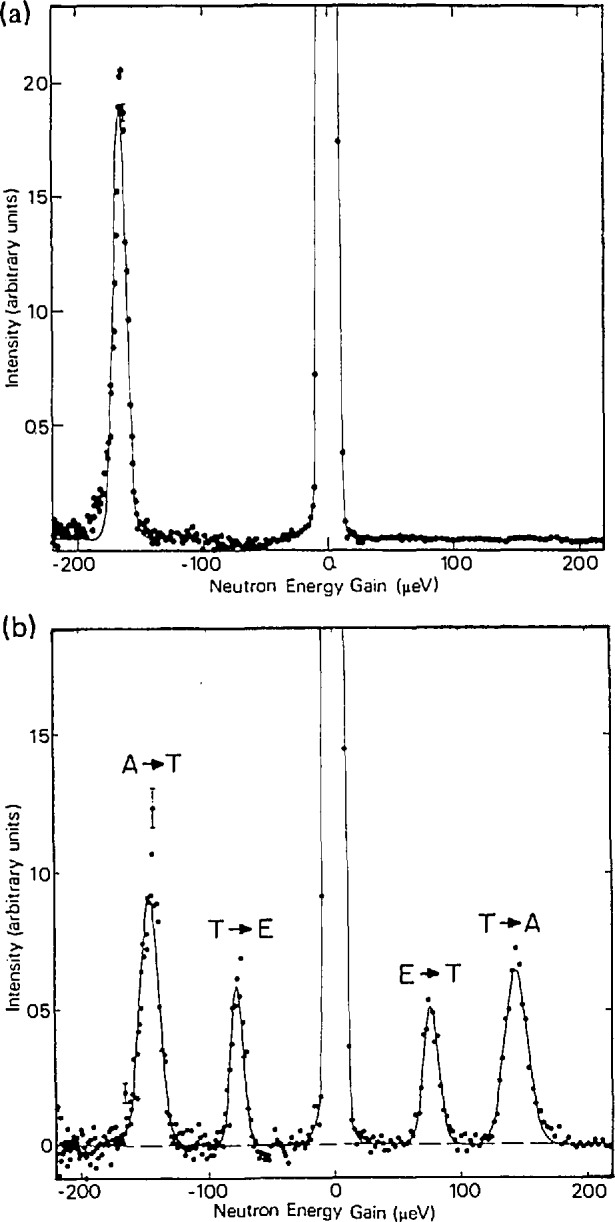
TOF spectra for 13 Å neutrons scattered by CH4 (phase II) at sample and spin temperatures of (a) < 0.2 K and (b) 5 K. The A−T and E−T transitions are labelled in (b) [18].

TOF spectra for 13 Å neutrons scattered by CH4 (phase II) at sample and spin temperatures of (a) < 0.2 K and (b) 5 K. The A−T and E−T transitions are labelled in (b) [18].