
Fig. 8.
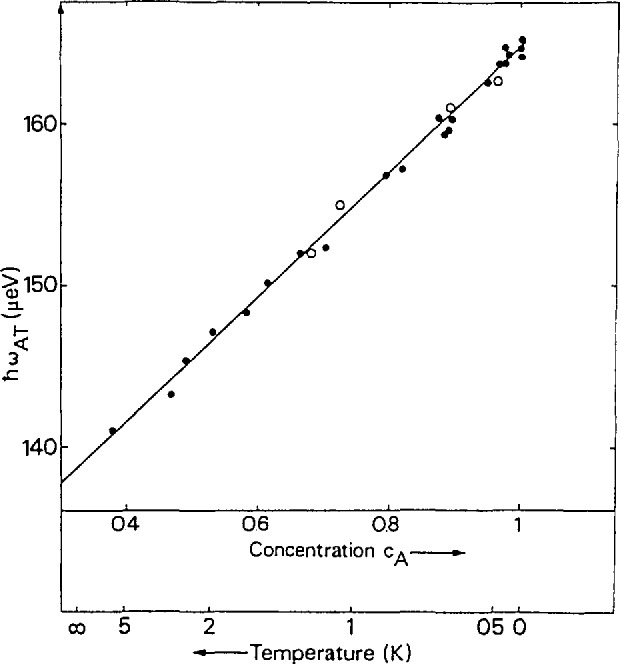
Energy of the A–T transition peak as a function of the concentration of the A spin species. The straight line represents a fit with the model of inhomogeneous broadening due to a changing mixture of spin states [18].
Official websites use .gov
A
.gov website belongs to an official
government organization in the United States.
Secure .gov websites use HTTPS
A lock (
) or https:// means you've safely
connected to the .gov website. Share sensitive
information only on official, secure websites.
Energy of the A–T transition peak as a function of the concentration of the A spin species. The straight line represents a fit with the model of inhomogeneous broadening due to a changing mixture of spin states [18].