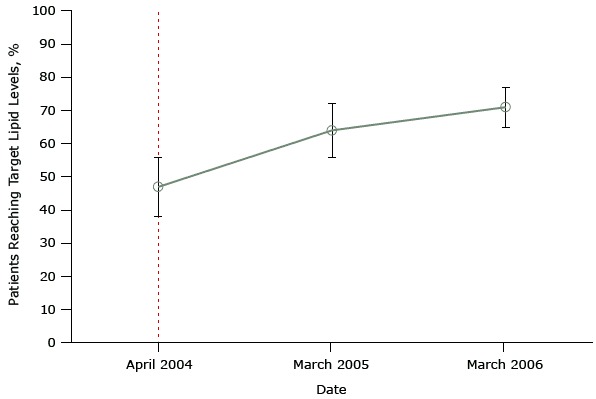
Figure 1.

Mean percentage of patients achieving a selected quality indicator — a target total cholesterol level of ≤5 mmol/L— in a sample of family practices that participated in a study evaluating the effect of the United Kingdom’s pay-for-performance policy. Dashed line indicates when the pay-for-performance policy was implemented (April 2004). Figure is based on data extracted from Table 2 of Tahrani AA, McCarthy M, Godson J, Taylor S, Slater H, Capps N, et al. Diabetes care and the new GMS contract: the evidence for a whole county. Br J Gen Pract 2007;57(539):483–5 (19).
| Month and Year | Percentage (Standard Deviation) of Patients Reaching Target Lipid Levels |
|---|---|
| April 2004 | 47 (9) |
| March 2005 | 64 (8) |
| March 2006 | 71 (6) |
