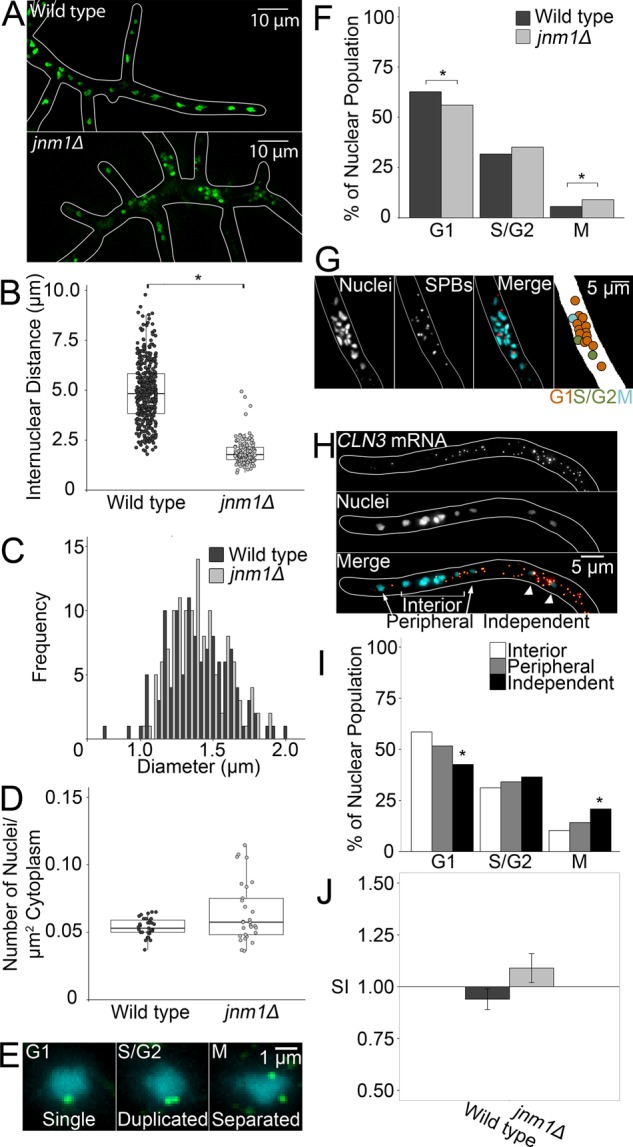
FIGURE 1:

jnm1Δ cells grow similarly to WT A. gossypii but with decreased internuclear distance. *p < 0.05 by Kolmogorov–Smirnov (KS) test (A–E) or Z test (F–J). (A) Representative image of WT and jnm1Δ cells. Nuclei are shown in green and hyphal outline in white. (B) Internuclear distance in WT and jnm1Δ cells (n ≥ 199 nuclei, clusters average ∼30 μm apart). (C) Nuclear diameter in WT and jnm1Δ (n > 110). (D) Number of nuclei per square micrometer of cytoplasm (n ≥ 29 cells; SD: WT, 0.007; jnm1Δ, 0.022). (E) Representative images of SBPs in different cell cycle stages. SPBs are shown in green and nuclei in cyan. Images are presented as maximum-intensity projections for clarity; however, analyses were performed using Z-series. (F) Percentages of nuclei in each cell cycle state in WT and jnm1Δ (n ≥ 849 nuclei). (G) Representative image of cycle stages within a jnm1Δ nuclear cluster. (H) Representative image of jnm1Δ nuclei in different positions. (I) Percentage of jnm1Δ nuclei in each position in each cell cycle stage (n ≥ 54 interior, n ≥ 30 peripheral, n ≥ 24 interior nuclei). (J) SI of WT and jnm1Δ nuclei (n ≥ 775 interactions). Bars denote SE.
