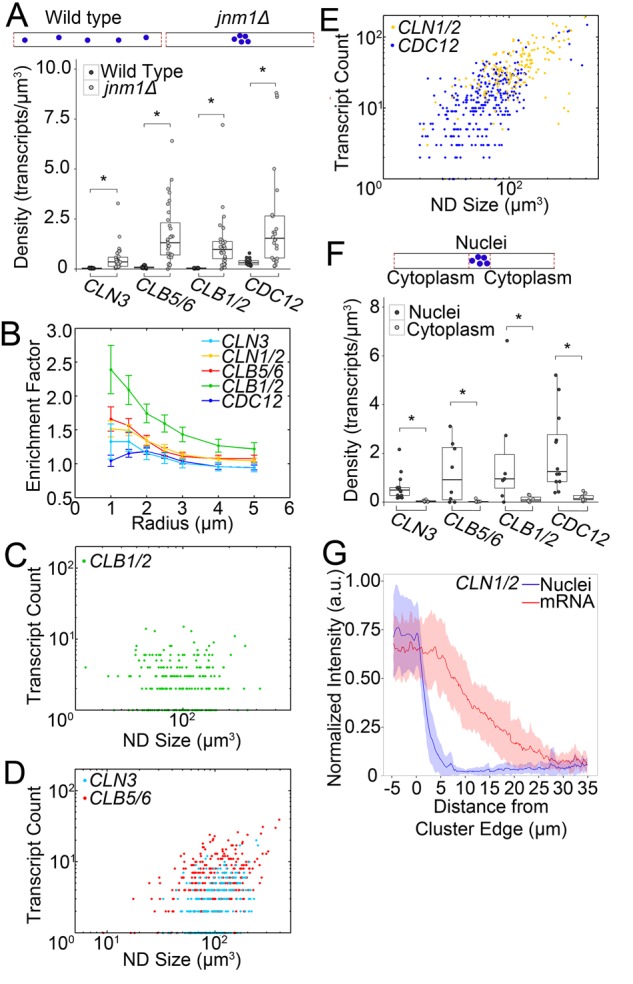
FIGURE 3:

mRNA is enriched near A. gossypii nuclei. *p < 0.05 by KS test. (A) Top, cytoplasmic regions compared between WT and jnm1Δ. Bottom, cytoplasmic transcript density in WT and jnm1Δ (n ≥ 14 hyphae). (B) Enrichment scores for transcripts relative to WT nuclei (n ≥ 161 nuclei). Bars denote SE. (C–E) Number of transcripts per nucleus by ND size (n ≥ 161 nuclei, CLB1/2 r = −0.01, CLN3 r = 0.40, CLB5/6 r = 0.40, CLN1/2 r = 0.62, CDC12 r = 0.62). (F) Top, nuclear cluster region and nucleus-free regions of cytoplasm. Bottom, cytoplasmic density in jnm1Δ clusters and nuclear-free regions (n ≥ 7 hyphae). (G) CLN1/2 transcript signal intensity relative to nuclear clusters (0 indicates cluster edge; n = 30 cluster edges). Shaded region denotes SD.
