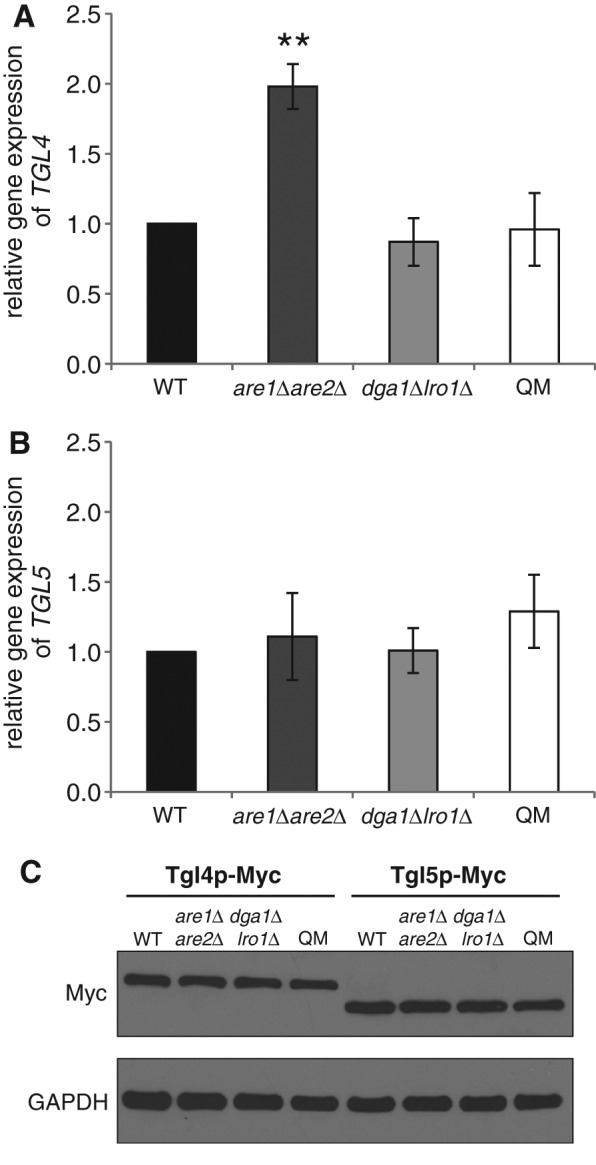
FIGURE 1:

Gene expression and protein levels of Tgl4p and Tgl5p in cells defective in nonpolar lipid synthesis. Relative gene expression of (A) TGL4 and (B) TGL5 in wild-type (WT) (black bar), are1Δare2Δ (dark gray bar), dga1∆lro1∆ (gray bar), and dga1∆lro1∆are1∆are2∆ QM (white bar) strains was quantified by real-time PCR. Wild type was set at 1. Data are mean values from at least three independent experiments with the respective deviation. Significance was calculated by Student’s t-test (two tailed, unpaired). **p < 0.005, defined to be significant. (C) Protein analysis of Tgl4-Myc and Tgl5-Myc from total cell extracts of WT, are1Δare2Δ, dga1∆lro1∆, and QM strains grown to mid logarithmic phase. The primary antibody was directed against the Myc tag (Myc). The cytosolic marker GAPDH was used as loading control.
