FIGURE 1:
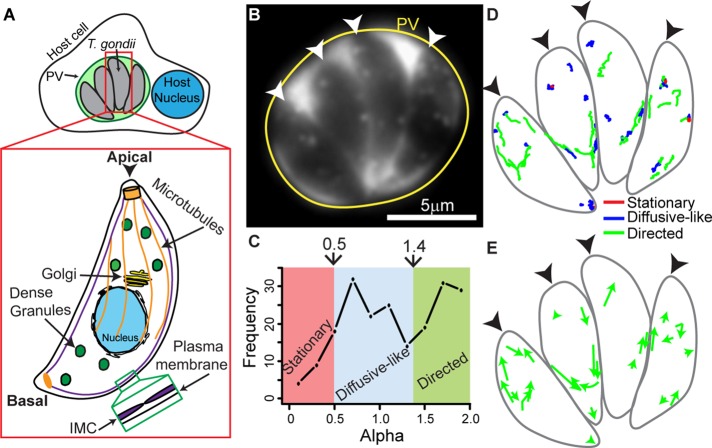
Characterization of dense granule motions in T. gondii. (A) Cartoon showing four T. gondii parasites growing inside a PV in a host cell. Inset shows cytoskeletal structures and organelles in T. gondii referred to in the text. Parasites contain 23 MTs (orange) that run two-thirds the length of the parasite, a single Golgi stack (yellow), and dense granules (green) distributed throughout the parasite. The inner membrane complex (IMC; green inset) is a series of flattened vesicles that are sutured together and underlie the parasite’s plasma membrane. The apical end of the parasite is indicated with an arrowhead. (B) Image of a four-parasite PV (yellow circle) with eGFP-labeled dense granules. eGFP accumulates in the PV after dense granule secretion. The apical end of each parasite is indicated with a white arrowhead. (C) Frequency distribution of MSD alpha values in control parasites. Trajectories with an α < 0.5 are classified as stationary (red), trajectories with an α between 0.5 and 1.4 are classified as diffusive-like (blue), and trajectories with an α > 1.4 are classified as directed (green). (D) Outline of parasites shown in B, with dense granule trajectories overlaid. Directed granule trajectories are indicated in green, diffusive-like trajectories are indicated in blue, and stationary trajectories are indicated in red. (E) Outline of parasites shown in B with directed dense granule trajectories in D depicted as arrows to highlight directionality. In D and E, black arrowheads indicate the parasites’ apical ends.

