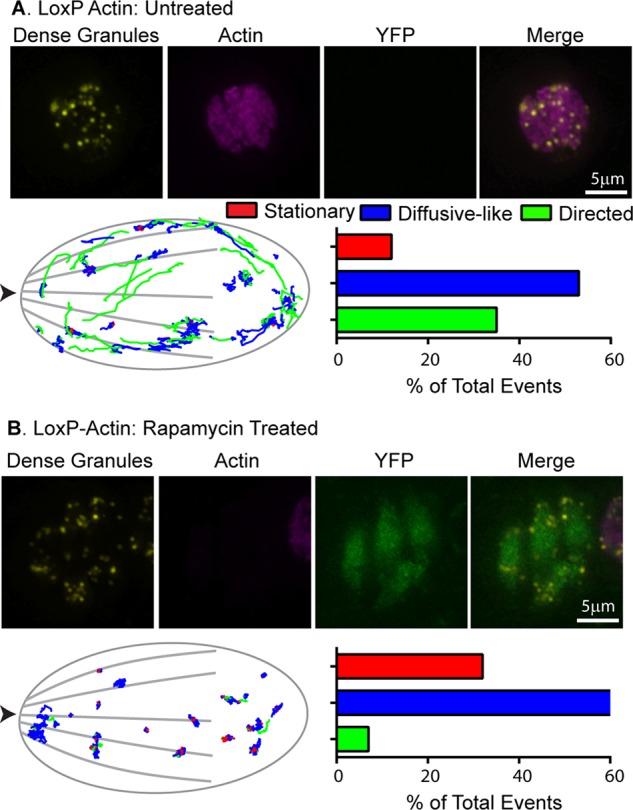
FIGURE 3:

Loss of TgACT1 perturbs directed dense granule motions. (A and B) Top, fluorescence images of control and rapamycin-treated LoxP-Actin parasites. Yellow: SAG1-ΔGPI-eGFP to identify dense granules; pink: anti-actin; green: YFP. (A and B) Bottom, left, parasite outline with dense granule trajectories from 10 parasites overlaid. Images were overlaid based on the x,y coordinates of the apical and basal ends of each parasite. Arrowhead indicates parasite’s apical end. Right, bar chart showing the percentage of granules exhibiting stationary (red), diffusive-like (blue), and directed (green) motion in each condition. See Supplemental Table S1 for trajectory specifics.
