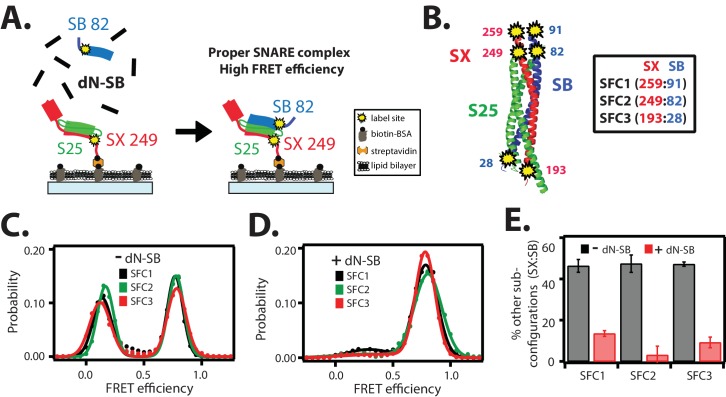
Figure 2. The dN-SB method achieves proper assembly of the ternary SNARE complex.
(A) Left panel: schematic of the dN-SB method for assembly of the ternary SNARE complex. The cytoplasmic domain of syntaxin-1A (SX, colored red) was surface-tethered through biotin-streptavidin (orange dot) linkage to a passivated microscope slide. Next, SNAP-25A (S25, colored green) was added. Subsequently, the cytoplasmic domain of synaptobrevin-2 (SB, colored blue) was added. For the dN-SB method, 10 μM dN-SB fragment was added concurrently with SB to the surface-tethered SX-S25 complex. Unbound proteins were washed away before smFRET measurements. Both SX and SB were labeled with fluorescent dyes (the SNARE label pair SFC2 is indicated by the yellow dots, SX 249 and SB 82). Right panel: properly assembled ternary SNARE complex is expected to produce high FRET efficiency for the SFC2 label pair. (B) Location of three SNARE label pairs (SFC1, SFC2, SFC3) in the crystal structure of the ternary SNARE complex (PDB ID: 1SFC), as defined in the legend. Separate experiments were performed for each of the three label pairs. Labeling of the two sites of a particular pair was performed separately with FRET donor and acceptor dyes (Alexa 555 and Alexa 647, respectively, Figure 2—source data 1) and the ternary SNARE complex was formed using the dN-SB method. The analysis was restricted to cases where FRET was observed, i.e., complexes that contain one donor and one acceptor dye. (C,D) smFRET efficiency histograms for the SNARE label pairs SFC1, SFC2, SFC3 for the surface-tethered ternary SNARE complex that was formed in the absence (C) and presence (D) of the dN-SB fragment. (E) Summary bar chart of the histograms shown in panels D,E, illustrating the effect of the dN-SB method in suppressing improper subconfigurations between SX and SB during the assembly of the ternary SNARE complex. “% other subconfigurations (SX:SB)” is calculated as the ratio of the areas under the two Gaussian functions that are fit to the low and high FRET efficiency states in the corresponding smFRET efficiency histograms, respectively. Shown are mean values ± SD for the two subsets of an equal partition of the data that are comprised of the observed FRET efficiency values for all molecules for each different condition (see data summary table in Figure 2—source data 1).
DOI: http://dx.doi.org/10.7554/eLife.16886.004

