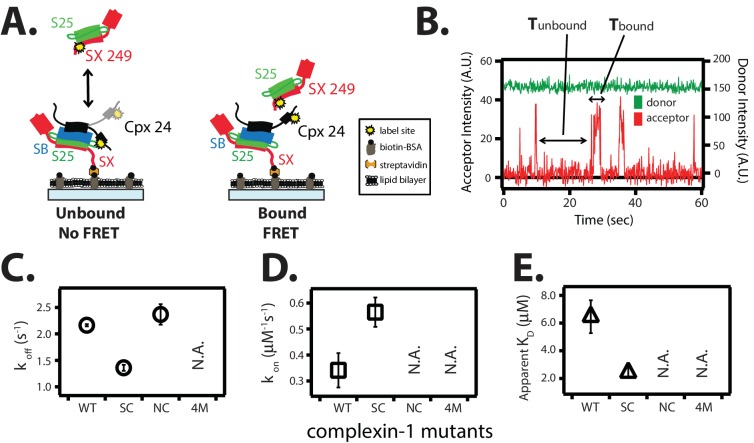
Figure 6. The trans conformation of complexin-1 can bridge a ternary and a binary SNARE complex through its central and accessory domains.
(A) Schematic of the single molecule binding experiment. The cytoplasmic domain of syntaxin-1A (SX) was surface-tethered through biotin-streptavidin (orange dot) linkage to a passivated microscope slide. Ternary SNARE complex (consisting of SX, the cytoplasmic domain of synaptobrevin-2 (SB), and SNAP-25A (S25)) was assembled using the dN-SB method. Full-length wildtype complexin-1 (Cpx [1-134]) was labeled with acceptor dye (Alexa 647) at residue position 24 (yellow dot). 50 nM of labeled complexin-1 was then incubated for 5 min to form complex with the surface-tethered ternary SNARE complexes. Unbound Cpx molecules were rinsed away. Next, purified binary SNARE complex (consisting of S25 and SX that was donor dye (Alexa 555) labeled at residue 249 of SX, yellow dot) was added at a concentration of 100 nM to the surface-tethered Cpx / ternary SNARE supercomplex. The appearance of acceptor dye fluorescence intensity indicates FRET from the binary SNARE complex and to the surface-tethered Cpx / ternary SNARE supercomplex. A data summary table for all experiments in this figure is provided in Figure 6—source data 1. (B) Representative single molecule fluorescence intensity time traces showing smFRET events between the complexin-1 accessory domain of complexin-1 / ternary SNARE supercomplex and a binary (syntaxin-1A / SNAP-25A) SNARE complex. The donor fluorescence intensity is colored green (scale on the right y-axis) and the acceptor fluorescence intensity (scale on the left y-axis) is colored red. Due to the high concentration of the donor labeled proteins in solution, there is no significant effect on the donor intensity upon FRET with an acceptor dye. The stepwise increase in acceptor fluorescence intensity represents bound states and the gaps in between bound states are unbound states. Tbound and Tunbound represent the dwell time of bound and unbound states, respectively. (C,D) Dissociation rates (C, open circles) and association rates (D, open squares) between binary SNARE complex and surface-tethered Cpx mutants (WT, wildtype; SC, superclamp mutant; NC, no clamp mutant, 4M, mutation of the central helix that prevents binding to ternary SNARE complex, see Figure 1A). Rates are calculated as described in Materials and methods. Error bars are standard deviations calculated from two subsets of an equal partition of the data (see data summary table in Figure 6—source data 1). (E) Apparent dissociation constant KD (= koff/kon) of binding between binary SNARE complex and Cpx or its mutants. Error bars are standard deviations calculated from two subsets of an equal partition of the data (see data summary table in Figure 6—source data 1).
DOI: http://dx.doi.org/10.7554/eLife.16886.016

