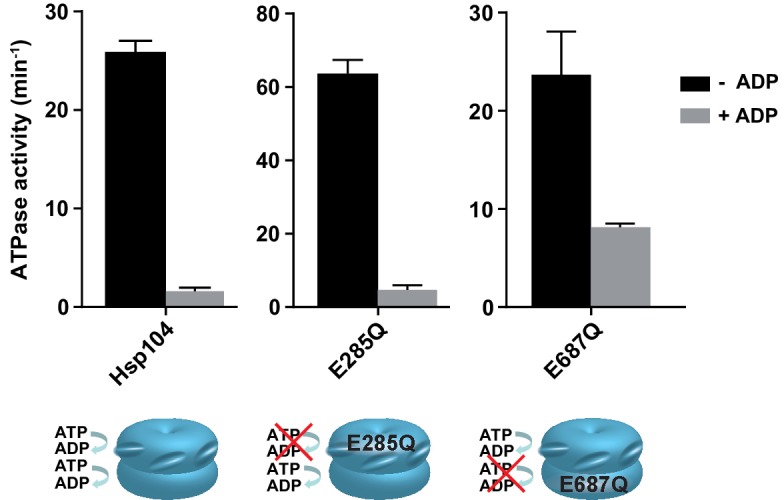
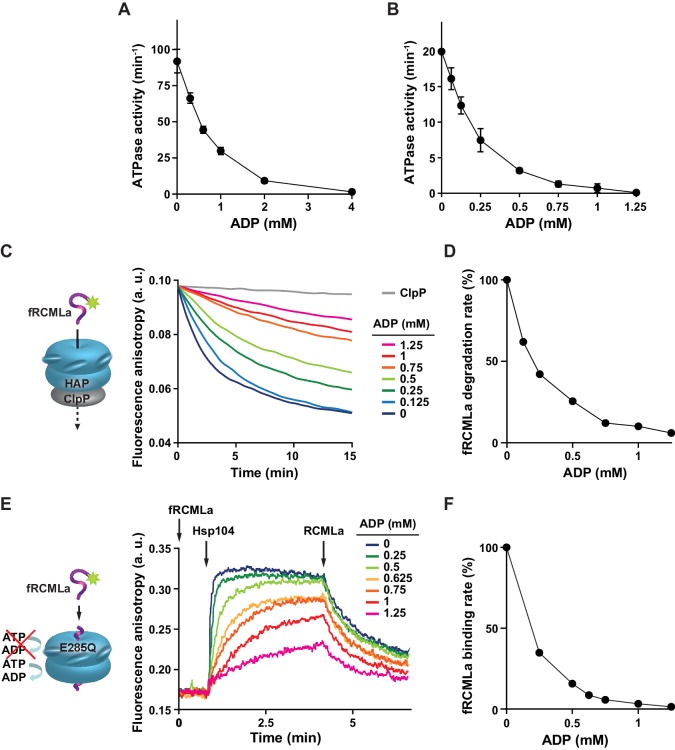
Figure 1. ADP restricts Hsp104 activities.
(A,B) ADP strongly inhibits the ATPase activity of Hsp104. The rate of ATP hydrolysis by Hsp104 was assessed (A) at 10 mM ATP or (B) at 2.6 mM ATP and at the indicated concentrations of ADP. Data are the mean of three independent experiments (± SD). (C) ADP inhibits fRCMLa translocation and proteolysis by HAP-ClpP. fRCMLa (5 μM) was incubated at 2.6 mM ATP with HAP (1 μM) and ClpP (1.8 μM) at the indicated concentrations of ADP and its proteolysis was measured by following changes in fluorescence anisotropy. In a control fRCMLa was incubated with ClpP without HAP (grey). (D) The rates of fRCMLa proteolysis by HAP-ClpP were calculated from the slopes of the fluorescence anisotropy curves for each ADP concentration shown in (C) and normalized to the HAP activity in the absence of ADP. (E) ADP impairs binding of Hsp104 to fRCMLa. Hsp104 E285Q (12 μM) was injected to the reaction mixture containing fRCMLa (1 μM), at 2.6 mM ATP and at the ADP concentrations indicated in the legend. After 200 s, non-labeled RCMLa was added to the final concentration of 40 μM. (F) The relative initial rates of fRCMLa binding by Hsp104 E285Q at the indicated ADP concentrations were calculated basing on the fluorescence anisotropy curves. a. u. – arbitrary units.
Figure 1—figure supplement 1. ADP inhibition of protein translocation through HAP.
Figure 1—figure supplement 2. ADP effect on ATP hydrolysis by Hsp104 Walker B mutants.


