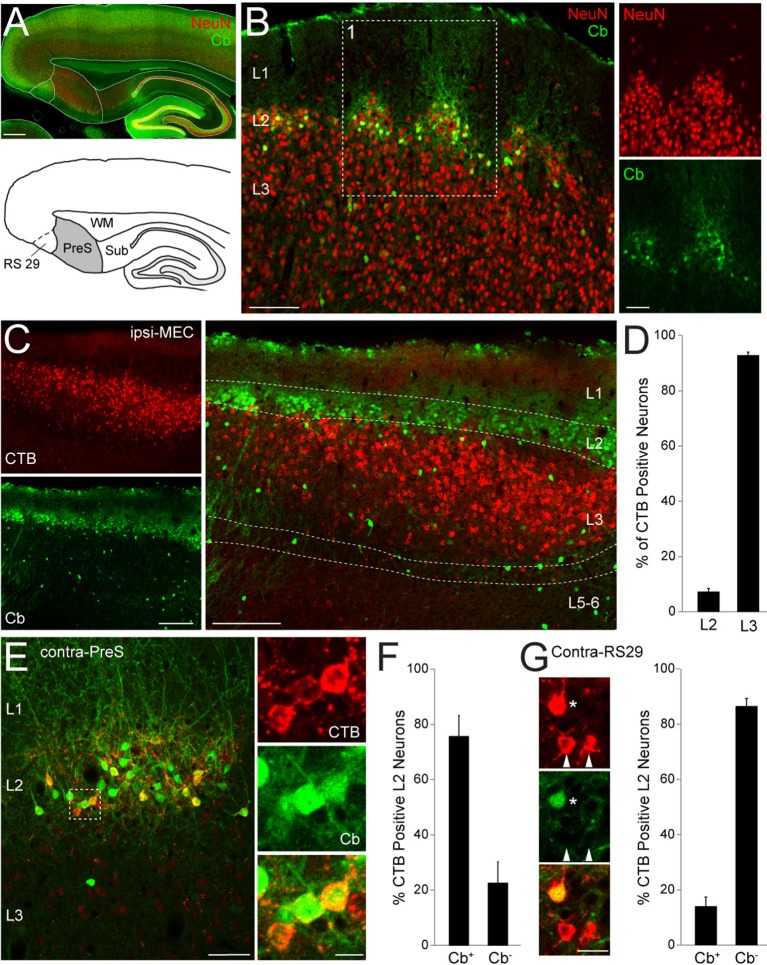
Figure 1. Anatomical organization and projection targets of superficial PreS neurons.
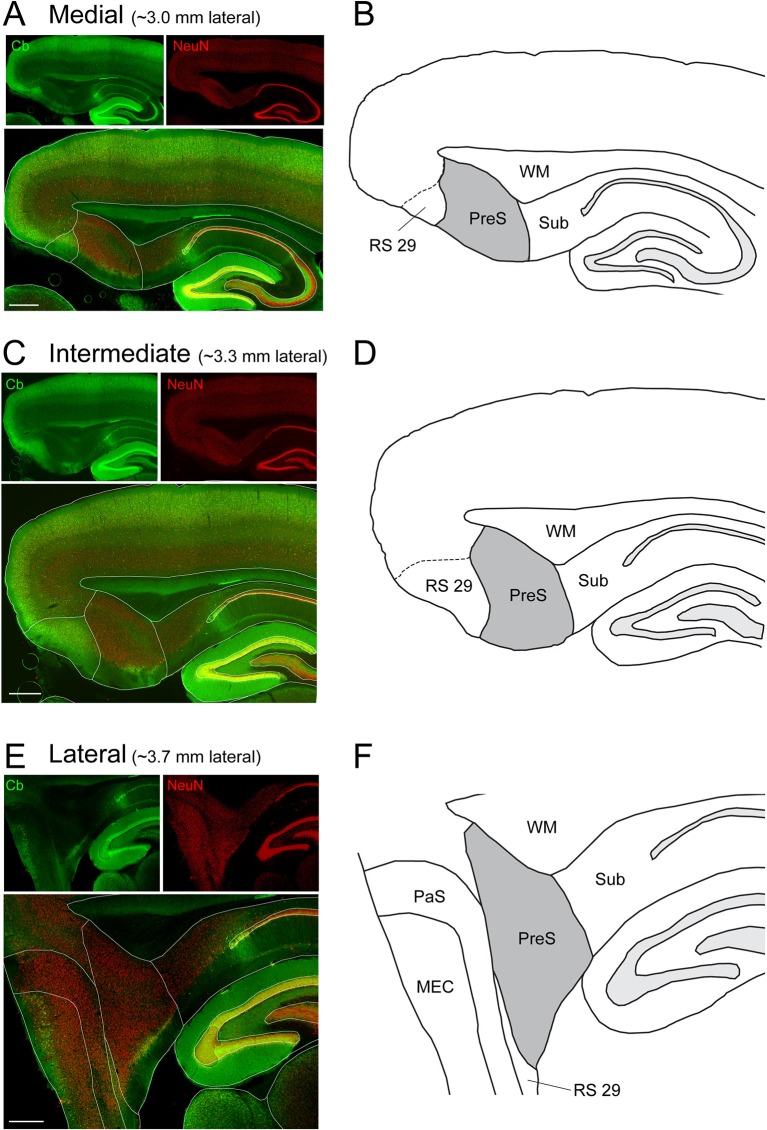
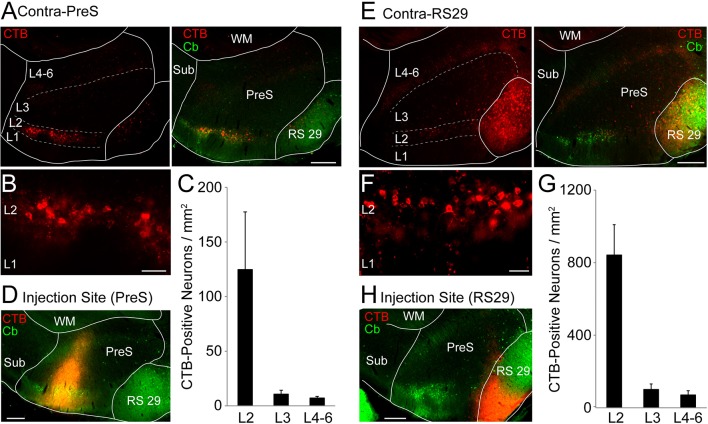
(A) Top, parasagittal section through the dorsal PreS stained for calbindin (Cb, green) and NeuN (red). Scale bar = 500 μm. Bottom, outline of the PreS (grey) from the section shown above. RS29 indicates the subfield of RS cortex which was targeted for retrograde tracing experiments. See Figure 1—figure supplement 1 for more details. (B) Superimposed staining for calbindin (green) and NeuN (red) showing the clustering of neuronal somata in L2 of PreS and the more homogeneous distribution of cells in L3. Right, close-up magnification of the single channels for panel 1 (red, NeuN; green, calbindin). Scale bars: 100 μm (left) and 50 μm (right). (C) Parasagittal section through PreS stained for calbindin (green) showing retrogradely-labeled neuronal somata following injection of CTB-Alexa 555 (red) in ipsilateral MEC (‘ipsi-MEC’). Left panels, single channels; right panel, overlay. Scale bars: 200 μm. (D) Bar-graph showing the % of retrogradely-labelled (CTB-positive) neurons in L2 and L3 of PreS, following tracer injection in ipsi-MEC (as shown in C; 4497 total counted neurons, n = 4 brains). Error bars indicate SEM. (E) Parasagittal section through PreS stained for calbindin (green) showing retrogradely-labeled neuronal somata following injection of CTB-Alexa 555 (red) in contralateral PreS (‘contra-PreS’). Scale bar: 50 μm. Right panel, close-up magnification of the inset shown on the left, showing three retrogradelly-labelled neurons (red) positive for the marker calbindin (green). Scale bar: 10 μm. (F) Bar-graph showing the % of calbindin-positive (Cb+) and calbindin-negative (Cb-) L2 neurons, which were retrogradely-labelled following tracer injection in contra-PreS (as shown in E; 159 total counted neurons, n = 3 brains). Error bars indicate SEM. (G) Left panels, close-up magnification PreS L2 neurons following injection of CTB-Alexa 555 (red) in contralateral RS29 and stained for calbindin (green). One calbindin-positive (asterisk) and two calbindin-negative neurons (arrowheads) are indicated. Scale bar: 10 μm. Right, bar-graph showing the % of calbindin-positive (Cb+) and calbindin-negative (Cb-) L2 neurons, which were retrogradely-labelled following tracer injection in contra-RS29 (896 total counted neurons, n = 4 brains). Error bars indicate SEM.


