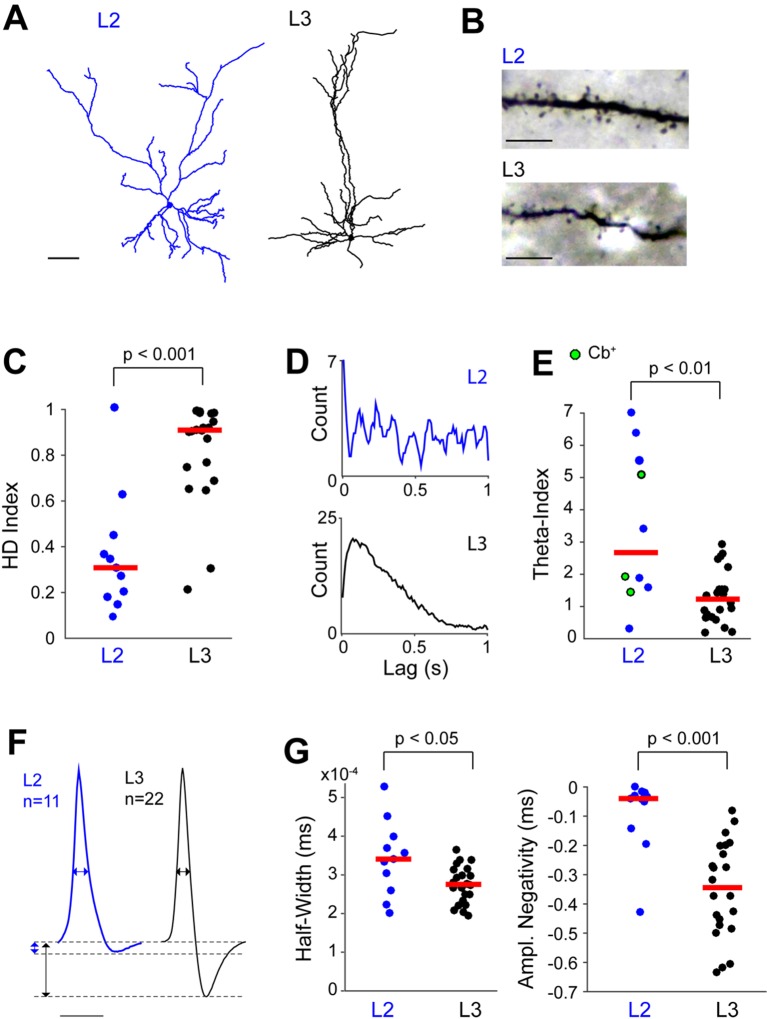
Figure 6. Morphological and electrophysiological properties of L2 and L3 PreS neurons.
(A) Morphological reconstruction of a representative L2 (blue, left) and L3 (black, right) neuron, recorded during passive rotation. Scale bar = 50 μm. (B) Representative high-magnification pictures of a dendritic segment of a L2 (top) and L3 (bottom) neuron. Note the presence of spines in high density in both dendrites. Scale bars = 10 μm. (C) HD indices for all identified L2 (n = 11) and L3 neurons (n = 22). Three L3 neurons were silent, and hence not included in the analysis. Horizontal red lines represent medians and the p value is indicated (Mann-Whitney U test). (D) Representative spike-autocorrelogram for an identified L2 (top) and L3 neuron (bottom). Note the theta-rhythmicity of spiking for the L2 neuron. (E) Theta indices for all identified L2 (n = 10) and L3 neurons (n = 22) which met inclusion criteria for the theta analysis (see Materials and methods). Horizontal red lines represent medians and the p value is indicated (Mann-Whitney U test). (F) Average spike waveforms for L2 (blue, n = 11) and L3 (black, n = 22) neurons. Three L3 neurons were not included in the analysis since they were silent. Horizontal and vertical double-arrowheads indicate spike half-widths and spike negativity amplitudes, respectively. Scale bar = 1 ms. (G) Spike half-widths (left) and spike negativity amplitudes (right) for L2 (n = 11) and L3 (n = 22) neurons. Horizontal red lines represent medians and the p value is indicated (Mann-Whitney U test).
DOI: http://dx.doi.org/10.7554/eLife.14592.012


