. 2016 May 23;5:e14925. doi: 10.7554/eLife.14925

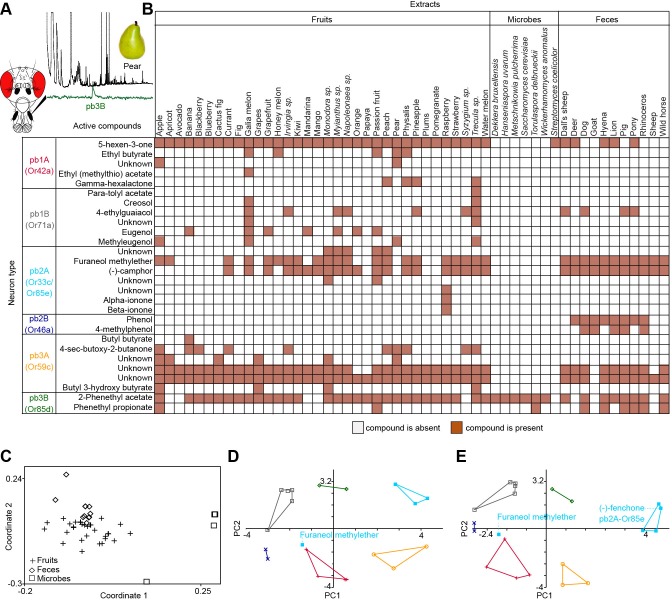
Figure 1. Screen for novel natural ligands for MP-OSNs.

(A) Representative gas chromatography-linked single sensillum measurement (GC-SSR) from pb3B (green trace) stimulated with headspace extract of pear (black trace). (B) Presence/Absence matrix of the physiologically active compounds identified from the different headspace extracts for each MP-OSN in the GC-SSR experiments (i.e. each filled box represents not only the presence of this odor in a specific fruit, but also a physiological response in GC-SSR recordings). (C) NMDS plot based on a presence/absence matrix for the active peaks across the tested samples. (D) PCA plot showing the distribution of the ligands recognized by MP-OSNs in a 32-dimensional odor space. PC1 and PC2 explain 23% and 22% of the variance, respectively. (E) PCA plot showing the distribution of the ligands recognized by MP-OSNs and (-)-fenchone (the main ligand of Or85e-expressing OSNs) in a 32-dimensional odor space. PC1 and PC2 explain 24% and 21% of the variance, respectively.

DOI: http://dx.doi.org/10.7554/eLife.14925.002

Figure 1—source data 1. Presence and absence data as well as physicochemical properties of all tested odor samples, that were used to calculate the NMDS plot and the PCAs in Figure 1.
DOI: 10.7554/eLife.14925.003

Figure 1.

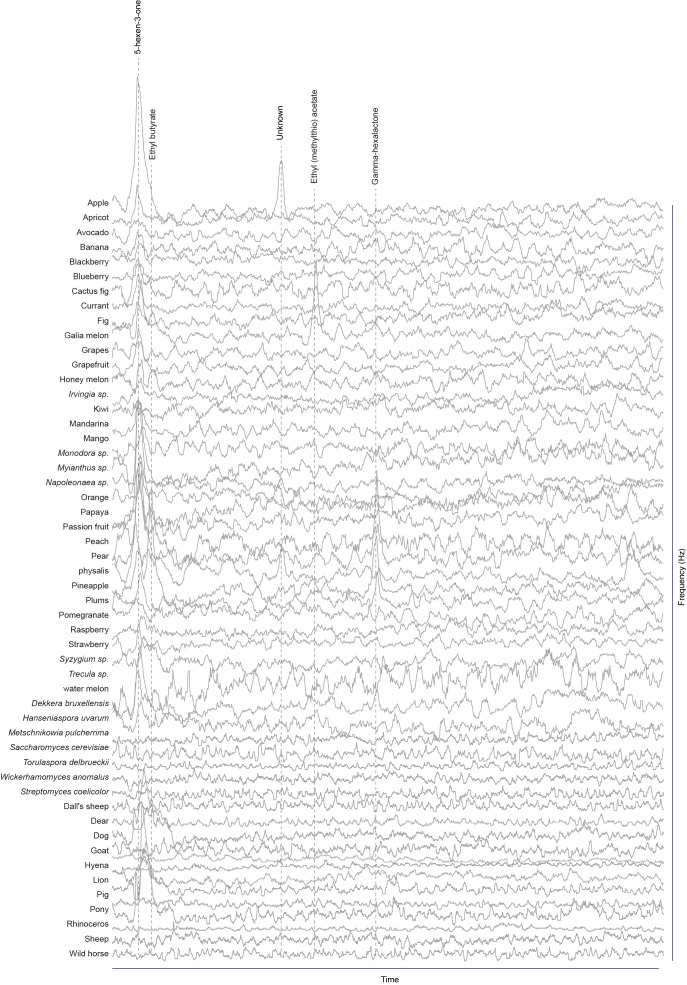
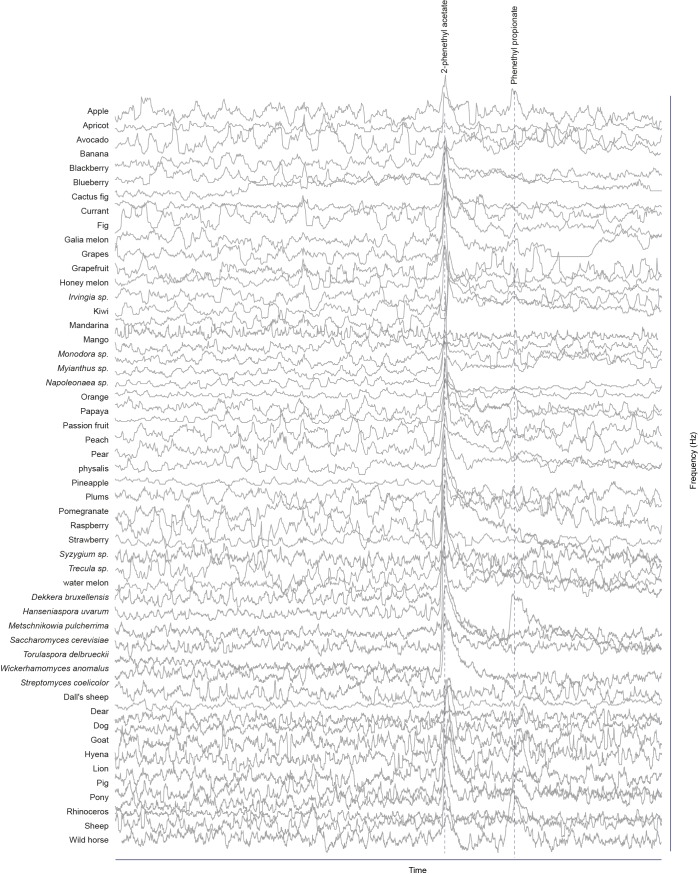
Figure 1—figure supplement 1. Responses of pb1A OSNs type to physiologically active compounds in different extracts.

Figure 1—figure supplement 1.

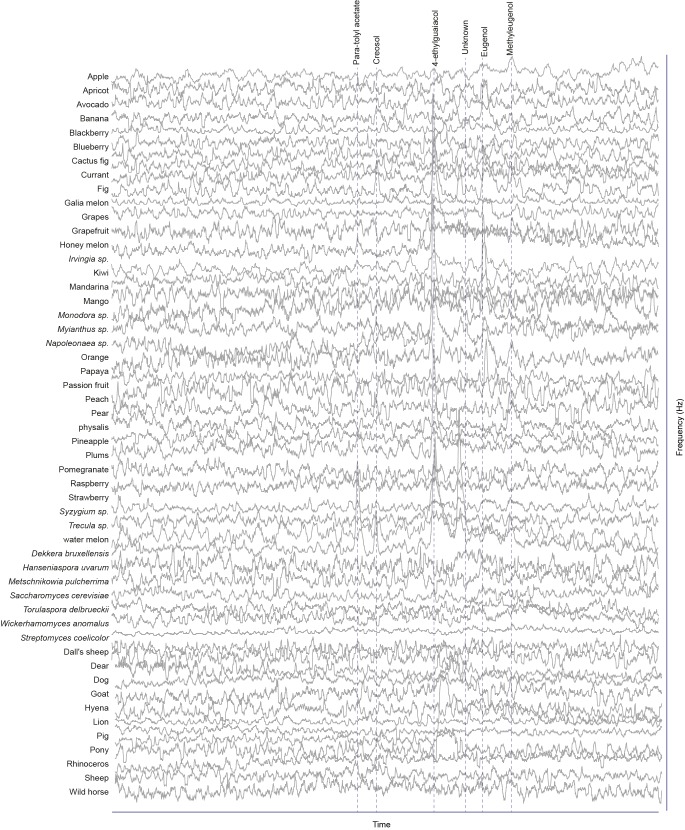
Figure 1—figure supplement 2. Responses of pb1B OSNs type to physiologically active compounds in different extracts.

Figure 1—figure supplement 2.

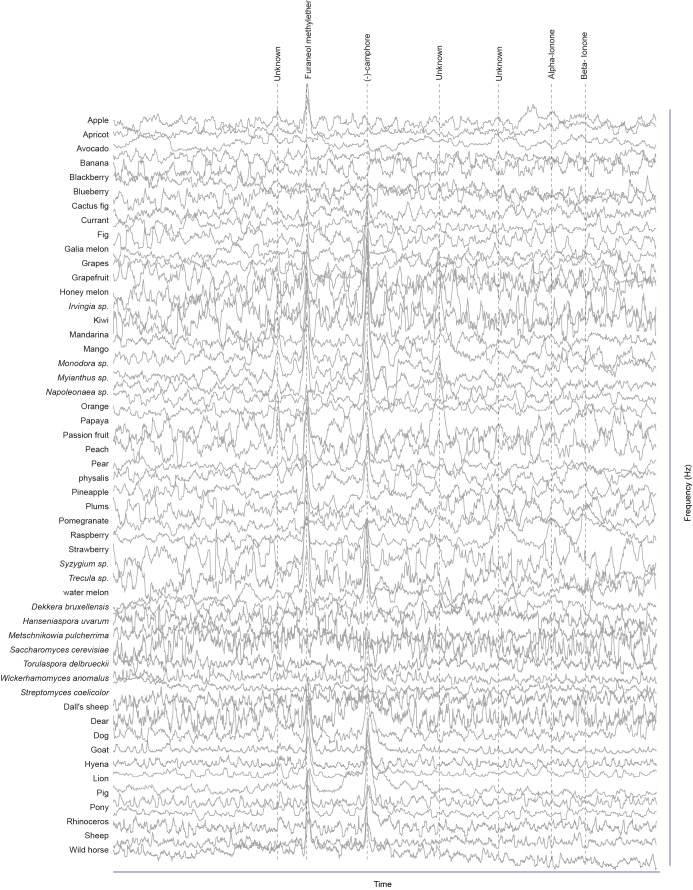
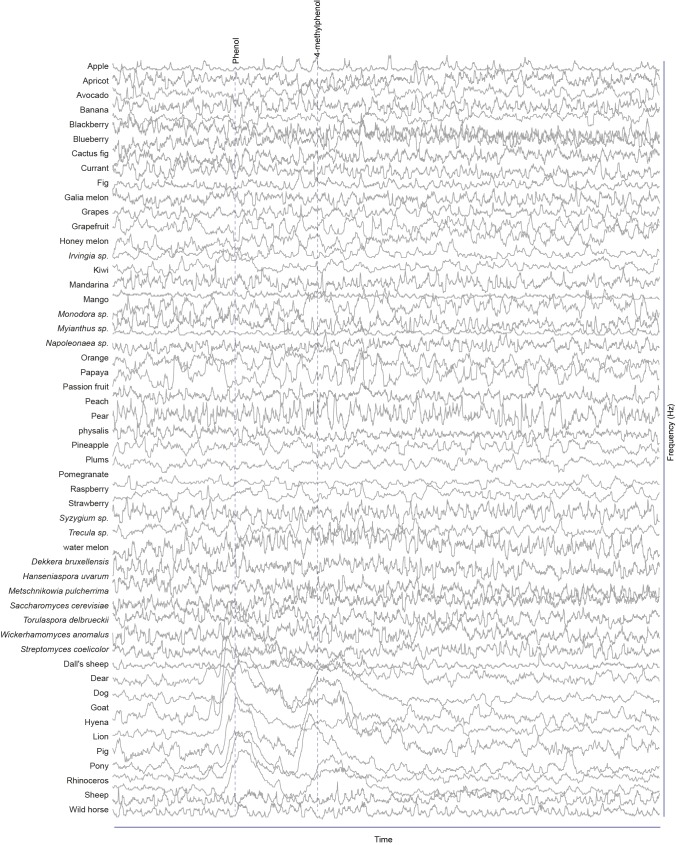
Figure 1—figure supplement 3. Responses of pb2A OSNs type to physiologically active compounds in different extracts.

Figure 1—figure supplement 3.

Figure 1—figure supplement 4. Responses of pb2B OSNs type to physiologically active compounds in different extracts.

Figure 1—figure supplement 4.

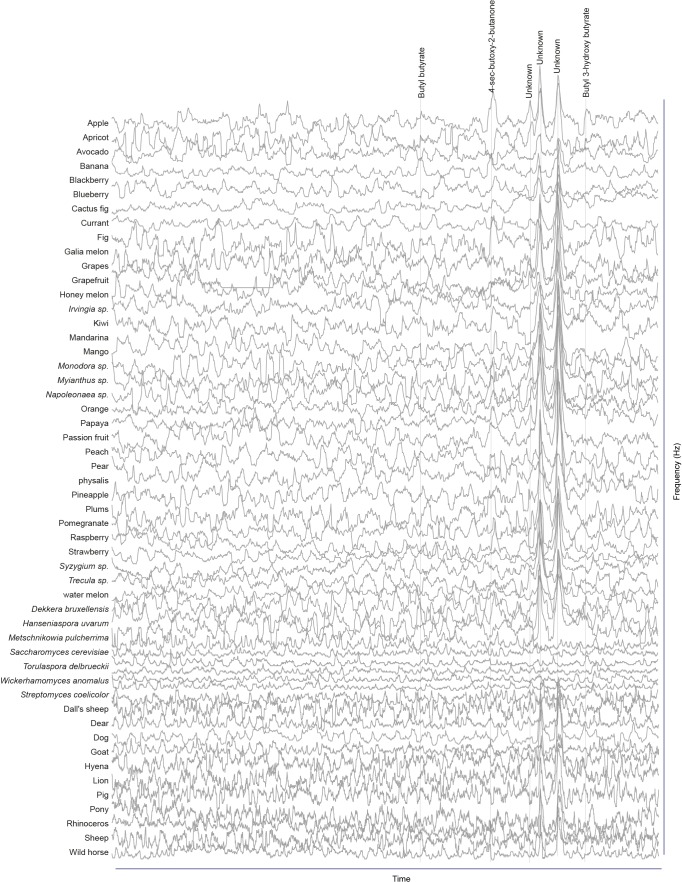
Figure 1—figure supplement 5. Responses of pb3A OSNs type to physiologically active compounds in different extracts.

Figure 1—figure supplement 5.

Figure 1—figure supplement 6. Responses of pb3B OSNs type to physiologically active compounds in different extracts.

Figure 1—figure supplement 6.

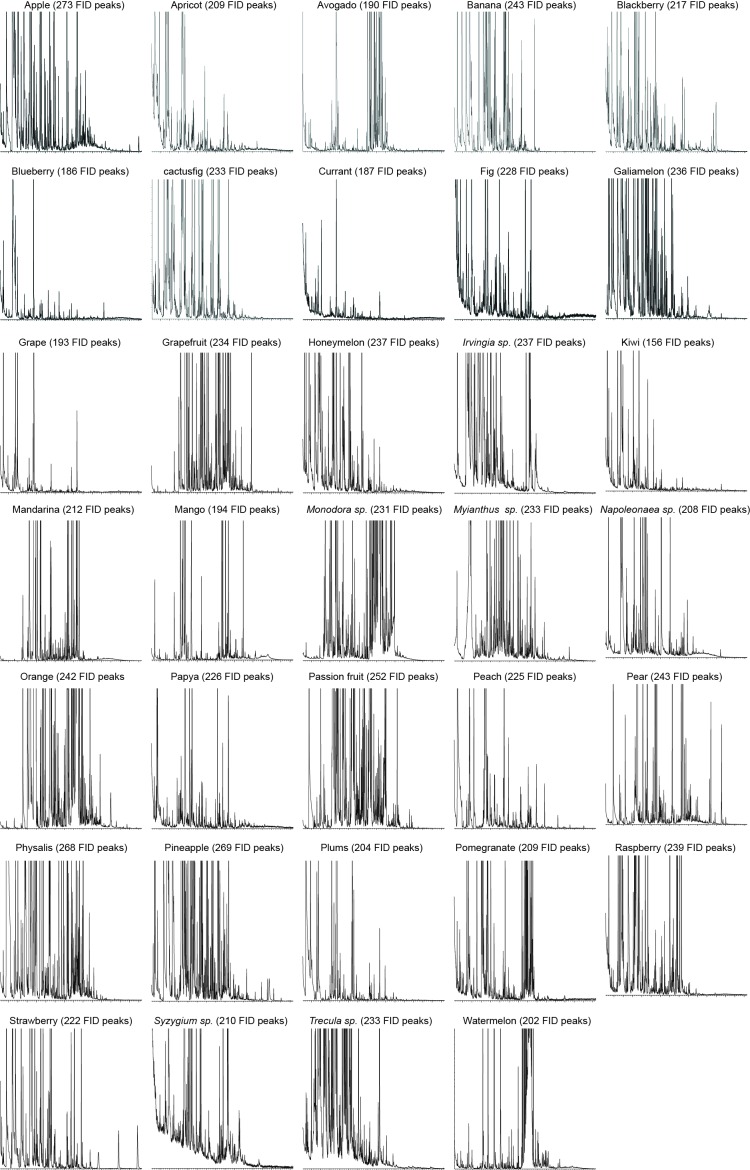
Figure 1—figure supplement 7. GC-MS chromatographs showing number of FID peaks in each fruit sample.

Figure 1—figure supplement 7.

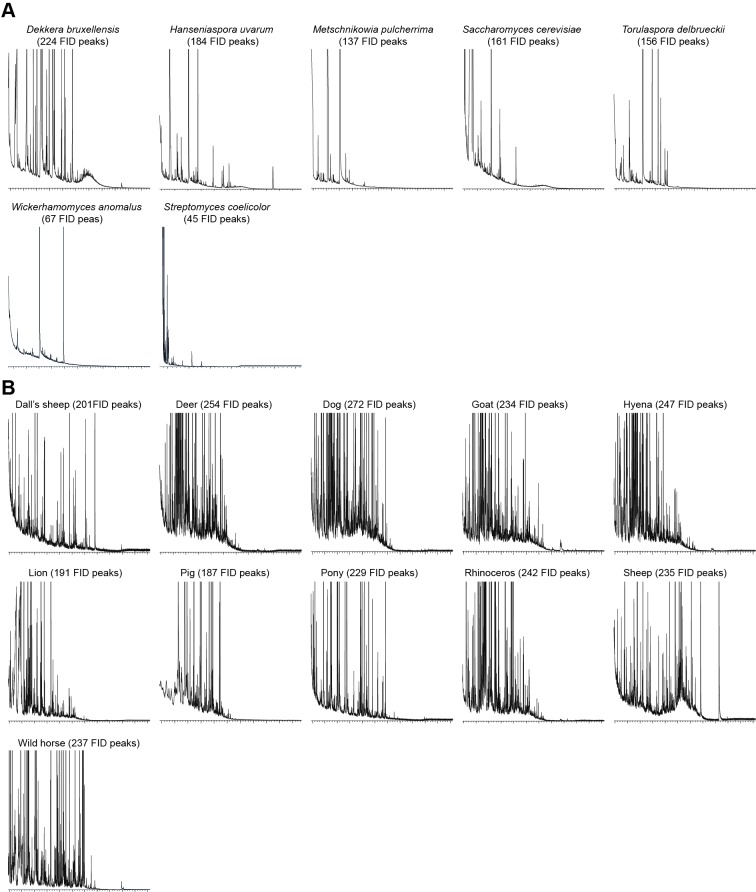
Figure 1—figure supplement 8. GC-MS chromatographs showing number of FID peaks in each microbial (A) and fecal (B) sample.

Figure 1—figure supplement 8.