Figure 6. The Munc13-1 C1C2BMUNC2C fragment bridges V-liposomes to T-liposomes.
(A,C,E,G) Intensity autocorrelation curves measured by DLS after 3 min incubations at 20°C on samples containing: (A) V-vesicles alone or in the presence of C1C2BMUNC2C and 100 μM EGTA or 500 μM Ca2+; (C) T-vesicles alone or in the presence of C1C2BMUNC2C and 100 μM EGTA or 500 μM Ca2+; (E) plain vesicles containing no PS alone or in the presence of C1C2BMUNC2C and 100 μM EGTA or 500 μM Ca2+, or a 1:1 mixture of plain vesicles and T-vesicles in the presence of C1C2BMUNC2C and 100 μM EGTA; (G) V-vesicles alone, T-vesicles alone, or 1:1 mixtures of V- and T-vesicles in the presence of C1C2BMUNC2C and 100 μM EGTA or 500 μM Ca2+. (B,D,F,H) Bar diagrams showing the particle size distribution in samples containing: (B) V-vesicles in the presence of C1C2BMUNC2C and 100 μM EGTA; (D) T-vesicles alone or in the presence of C1C2BMUNC2C and 100 μM EGTA; (F) a 1:1 mixture of plain vesicles and T-vesicles in the presence of C1C2BMUNC2C and 100 μM EGTA; (H) a 1:1 mixture of V- and T-vesicles in the presence of C1C2BMUNC2C and 100 μM EGTA. These bar diagrams correspond to the autocorrelation curves of selected samples among those shown in (A,C,E,G) and are intended to illustrate that mixtures of clustered and non-clustered vesicles can be readily distinguished (F), and that Ca2+-free C1C2BMUNC2C does not cluster isolated V-vesicles (B) but bridges V- to T-vesicles (H).

Figure 6—figure supplement 1. Concentration dependence of the liposome clustering activity of Munc13-1 C1C2BMUN and C1C2BMUNC2C.

Figure 6—figure supplement 2. Lipid binding to distinct Munc13-1 fragments monitored by liposome co-floatation assays.

Figure 6—figure supplement 3. Ca2+-free C1C2BMUNC2C does not cluster V-liposomes.

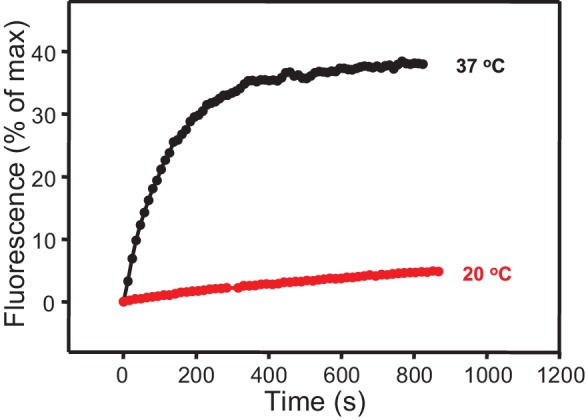
Figure 6—figure supplement 4. Minimal stimulation of lipid mixing between V- and T-liposomes in the presence of C1C2BMUNC2C at 20°C.