
FIGURE 4.
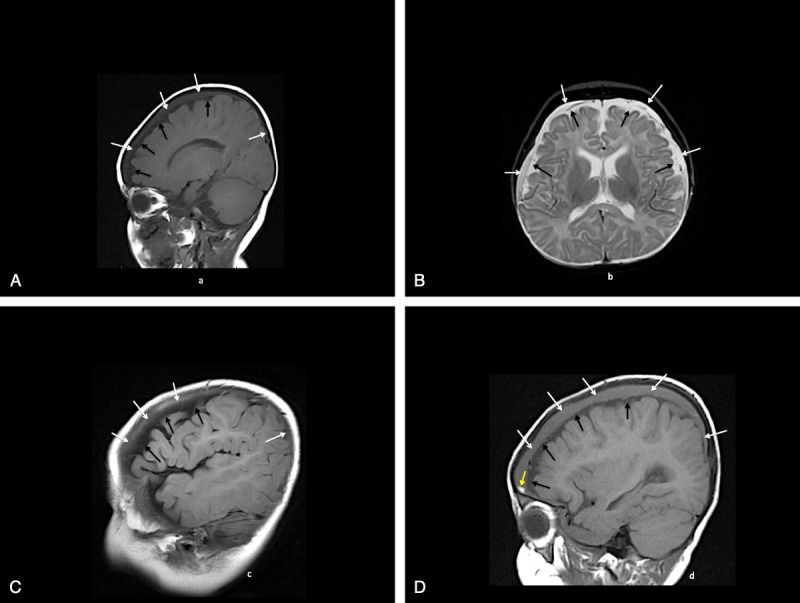
A, Patient 4: initial MRI sagittal T1 image (A) shows inner low-intensity subarachnoid spaces (black arrows) and outer gray intensity subdural collections (white arrows). B, Patient 4: initial MRI axial T2 image (B) shows inner high-intensity subarachnoid spaces (black arrows) and outer high-intensity subdural collections (white arrows) separated by intervening low-intensity membranes and veins. C, Patient 4: MRI 6 months later, sagittal T1 image (D) shows inner low-intensity subarachnoid spaces (black arrows) and outer gray intensity enlarging subdural collections (white arrows) plus smaller high-intensity more recent hemorrhage (yellow arrow). D, Patient 4: MRI 8 weeks later, sagittal T1 image (C) shows inner low-intensity subarachnoid spaces (black arrows) and outer gray intensity subdural collections (white arrows).