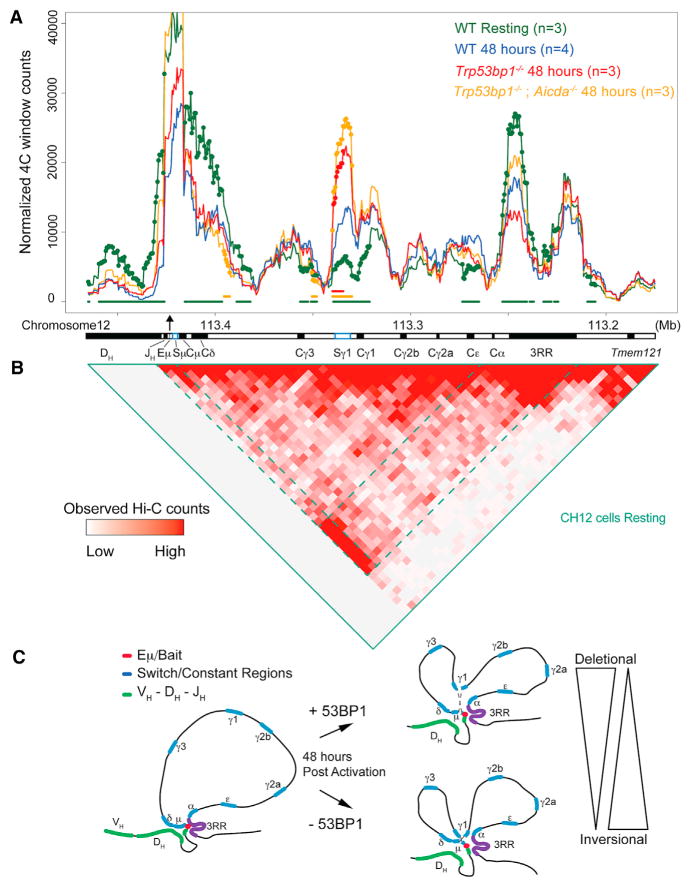
Figure 3. 53BP1 Impacts the Architecture of Igh during CSR.
(A) 4C-seq using a bait (black arrow) located on the Eμ enhancer. Lines represent the average 4C signal across replicates. Colored circles represent the 10-kb windows that have significant changes in contact frequency (adjusted p value < 0.05) from wild-type (WT) at 48 hr. For easier visualization, colored bars below lines represent consecutive windows that are statistically different from WT controls at 48 hr. For simplicity, only μ and γ1 switch regions are shown (blue boxes).
(B) Hi-C on the same region in CH12 cells. Dashed lines represent interactions between Eμ and 3RR. Hi-C data are from the CH12 in-situ-combined track described in Rao et al. (2014).
(C) Model shows changes in constant region locus conformation upon activation in WT and 53BP1-deficient cells and how these changes might favor inversional rearrangements.

