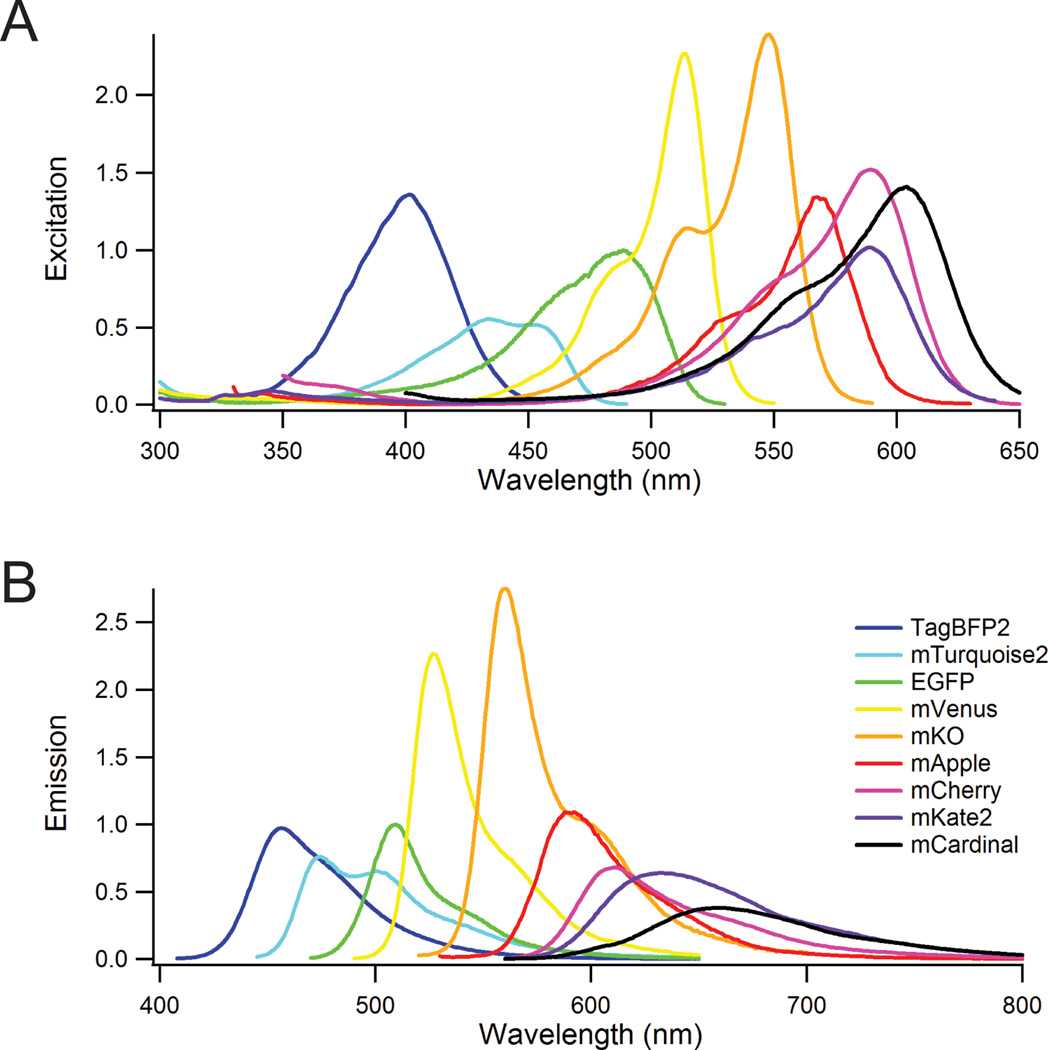
Figure 1.
Excitation and emission spectra of several commonly used FPs across the visible region. The peak values of the excitation spectra (A) are normalized to EGFP = 1 by the extinction coefficient, and the emission spectra peaks (B) are normalized to EGFP = 1 by their relative brightness (extinction coefficient × quantum yield).

