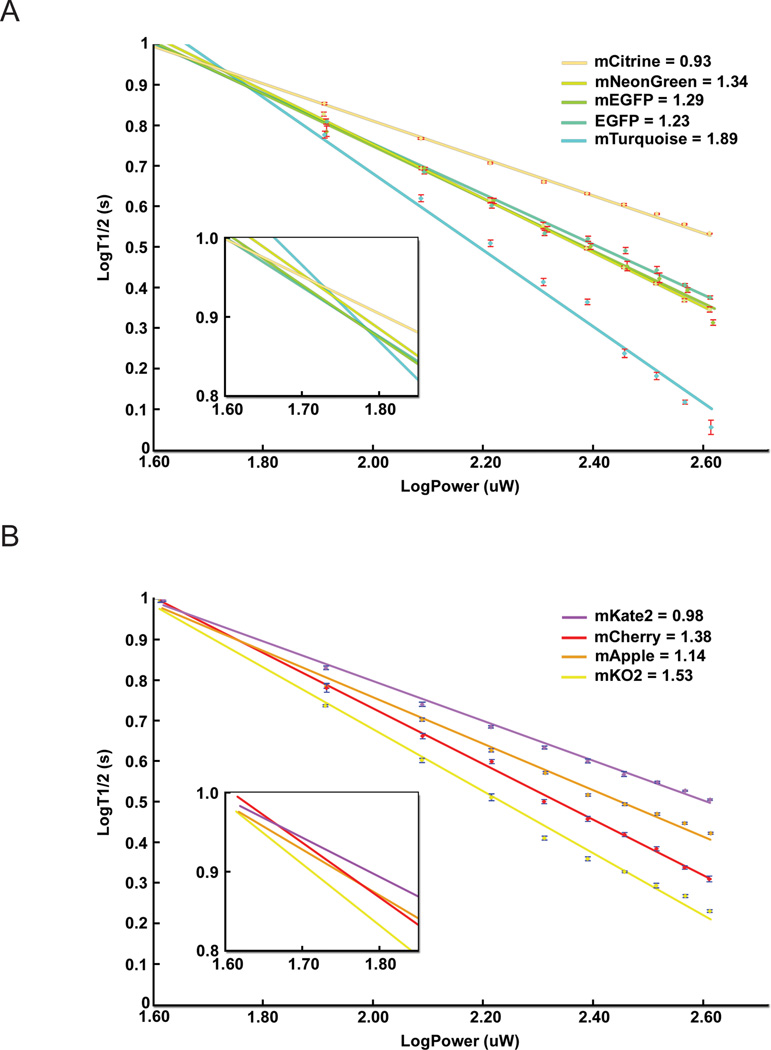
Figure 2.
Log-Log plot of photobleaching rates vs. illumination power as measured by laser scanning microscopy – similar power dependence is seen with widefield lamp or LED illumination (see Table 2). Data points are plotted as average and standard deviation as described in the methods. Panel (A) shows the excitation intensity dependence for a few common cyan, green, yellow FPs, while (B) shows the behavior for orange and red FPs. For each FP, the fit value of the exponent α is given on the legend.

