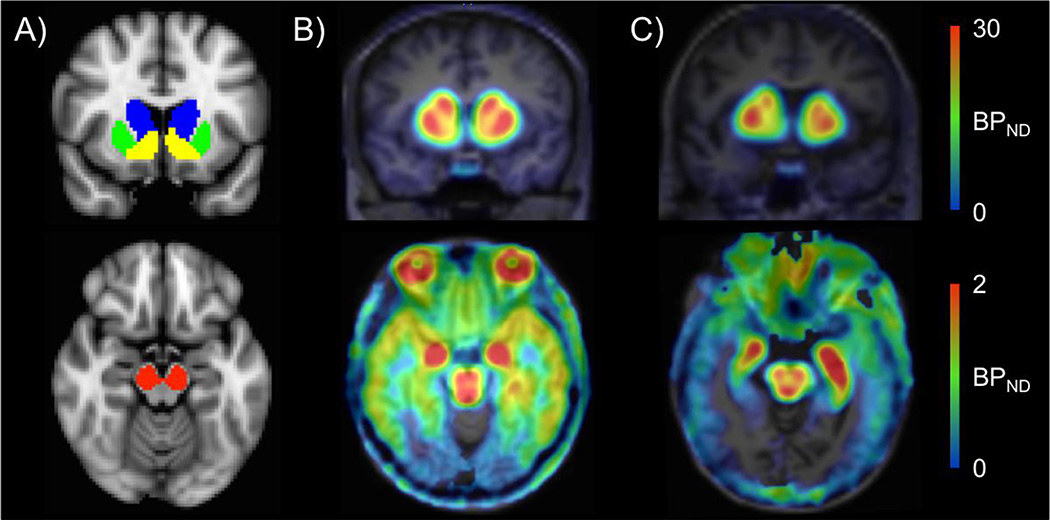
Fig 1.
ROIs and binding potential (BPND) images. A) Striatal (top) and midbrain (bottom) ROIs used for extracting BPND. B) One under 30-year-old subject’s and C) one over 30-year-old subject’s [18F]fallypride BPND images in native PET space. BPND, which declined with age, was highest in the striatum (top) and the midbrain (bottom). Note that the BPND maps use different scales to reflect the large differences in BPND values in striatal and extrastriatal brain regions.

