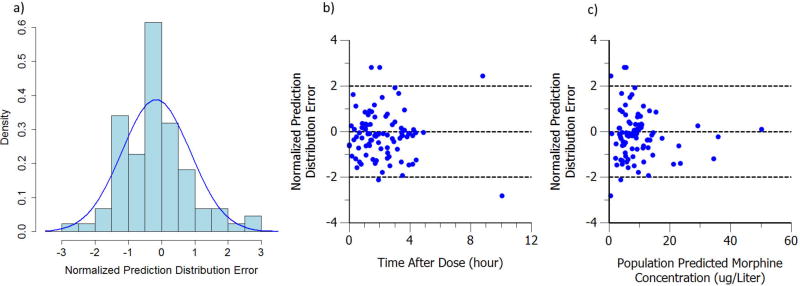
Figure 6.
a) Histogram of normalized prediction distribution error. The blue curve is the normal distribution with corresponding mean (-0.169) and standard deviation (1.03). b) Normalized prediction distribution error versus time after dose. c) Normalized prediction distribution error versus population prediction. The three dash lines represent NPDE (CWRES) = -2, 0 and 2 separately

