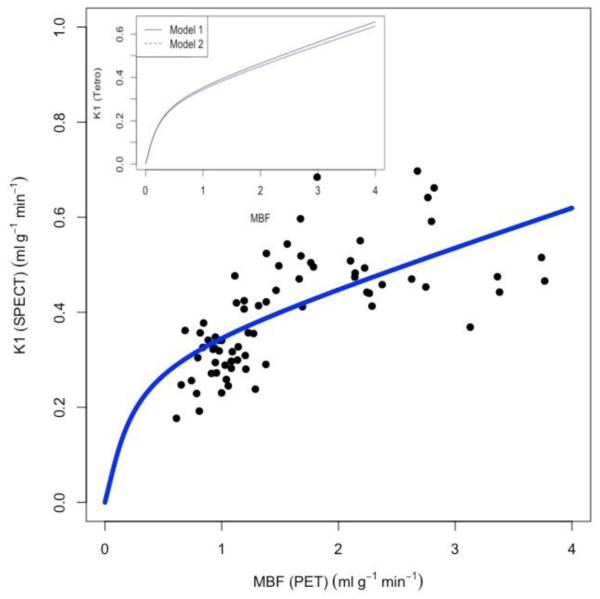
Figure 2.
Scatter plot and fit of K1 estimates (solid curve, blue) for 99mTc-tetrofosmin using the model to the experimental data (filled circles, black) (R2=0.49) for the subgroup of 9 patients at rest and stress. The best fit curve gave the extraction parameters A=0.91±0.11; B=0.34±0.20 for 99mTc-tetrofosmin. Insert: Comparison of the two models (1) (full line) and (2) (dotted line). In model (2) the capillary PS value is (α) * F + (β) = (0.091 ± 0.10) * F + (0.32 ± 0.16). ANOVA test revealed that there was no significant difference between the two models (p<0.001).

