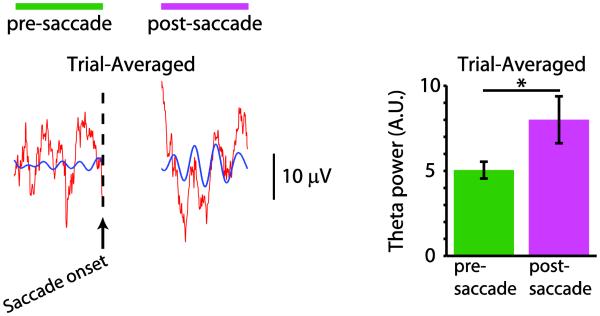
Figure 2. Neural activity in monkey hippocampus is locked to eye movements.
LEFT: Trial-averaged LFP is aligned to saccade onset. Theta oscillations show phase alignment across trials after the saccade, which translates to visible theta oscillations in the trial-averaged LFP (scale bar = 600 ms). Red trace shows raw, trial-averaged LFP, and blue trace shows theta-filtered LFP. RIGHT: Theta (6.7-11.6 Hz) power for the trial-averaged LFP for pre-saccade (green) and post-saccade (pink) periods. Theta power was significantly higher for the post-saccade period than for the pre-saccade period (*P < 0.05). Figure from Jutras, Fries and Buffalo (2013).

