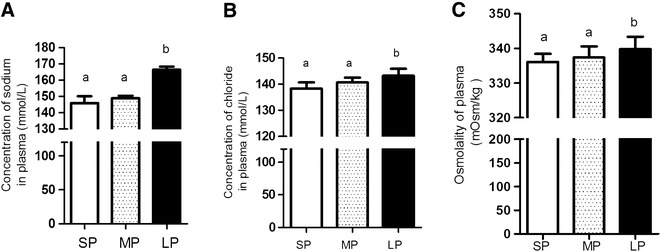
Fig. 2.

Ion parameters in plasma in two groups of flounders. The concentration of sodium (A), chloride (B) and osmolality of plasma (C). Data are presented as mean ± SEM, N = 6. Different letters above bars mean significant differences among the three groups
