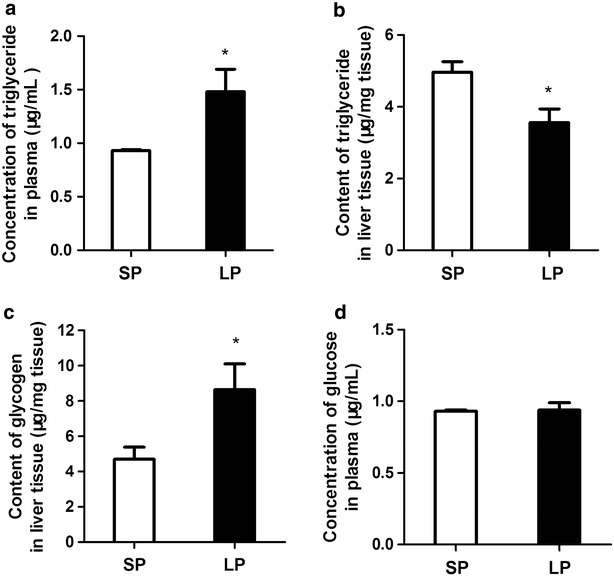
Fig. 3.

The blood and liver metabolic parameters in two groups of flounders. Content of triglyceride in plasma (a) and liver tissue (b), content of glycogen in liver tissue (c), concentration of glucose in blood (d). Data are presented as mean ± SEM, N = 6. Asterisk P < 0.05 indicates significant difference between the two groups
