Fig. 3.

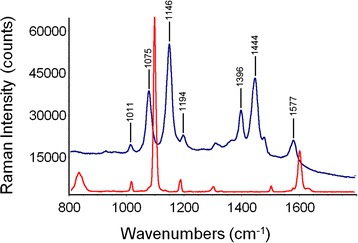
Raman (red trace) and SERS (blue trace) spectrum of pMA. The estimated number of sampled molecules is 2.55 × 10¹¹ for the Raman spectrum and 2.90 × 10⁶ for SERS, so that an enhancement factor of about 105 can be estimated

Raman (red trace) and SERS (blue trace) spectrum of pMA. The estimated number of sampled molecules is 2.55 × 10¹¹ for the Raman spectrum and 2.90 × 10⁶ for SERS, so that an enhancement factor of about 105 can be estimated