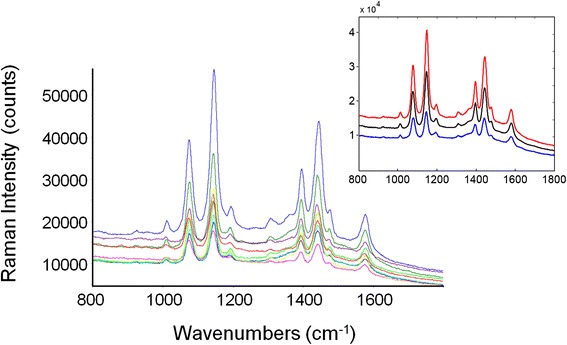
Fig. 5.

SERS spectra collected on different points of the Au-diatom surface. The inset displays the average SERS spectrum (black trace) and the average spectrum ± standard deviation (blue and red traces)

SERS spectra collected on different points of the Au-diatom surface. The inset displays the average SERS spectrum (black trace) and the average spectrum ± standard deviation (blue and red traces)