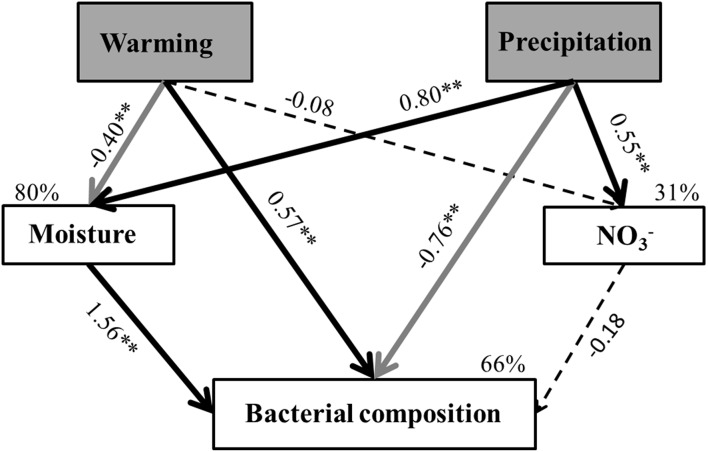
Figure 5.
Structural equation model shows the effects of warming and altered precipitation on soil bacterial composition. Causal influences of warming and altered precipitation (exogenous variable; gray rectangle) on soil , soil moisture and bacterial community composition (endogenous variables; white rectangle). The model fit the data well: χ2 = 1.22, df = 2, P = 0.54, GIF = 0.98, RMSEA < 0.001 Numbers on arrows are standardized path coefficients (equivalent to correlation coefficients), asterisks followed the numbers means significant relationships (**p < 0.01 and *p < 0.05). Dark solid arrows indicate significant positive relationships, gray solid arrows indicate significant negative relationships and black dash arrows indicate non-significant path coefficients (p > 0.05). Width of the arrows shows the strength of the causal relationship. Percentages (R2) close to endogenous variables indicate the variance explained by the climatic and soil factors.

