
FIGURE 8.
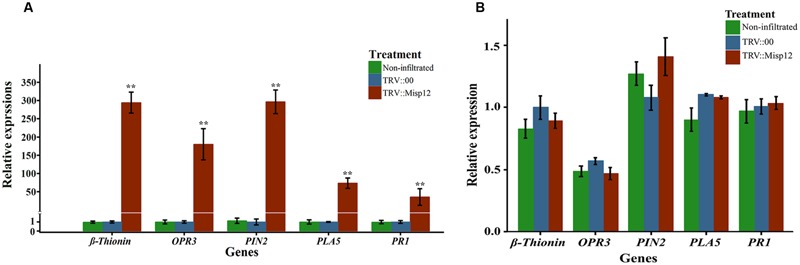
Relative expression levels of genes involved in JA and SA signaling defensive pathways. (A) Expression level of five JA and SA signal pathway mark genes in Misp12-silencing root at 28 DAI with M. incognita. (B) Expression level of the same mark genes in Misp12-silencing root at 5 DAI. The graph showed the mean and standard error of the relative amount of transcripts of these genes in Misp12-silencing root (TRV::Misp12) in comparison with TRV-vector transformed control roots (TRV::00) growing under the same conditions. Each reaction was performed in triplicate and the results represented the mean of three independent biological replicates. Columns for the same time point or treatment marked with ∗∗ are significantly different (P < 0.01) from each other based on Student’s t-test.