
Fig. 2.
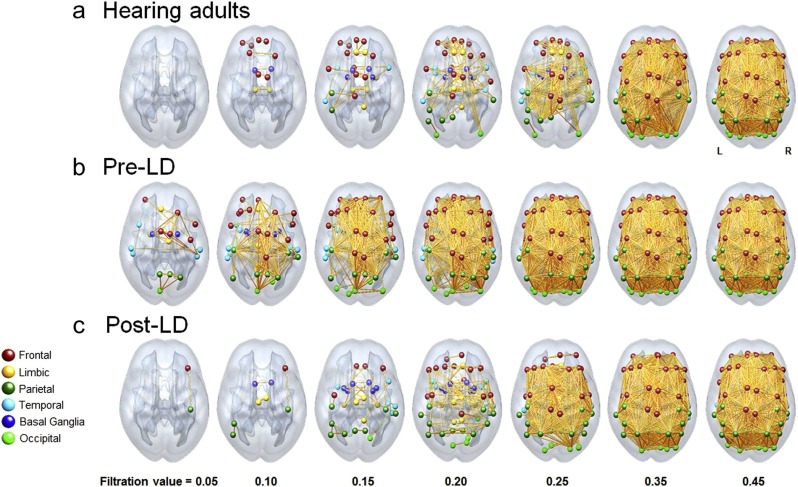
Filtered brain networks constructed from interregional correlations of density from MRI detect differences in hearing and deaf populations. Density correlation networks obtained from (a) hearing, (b) prelingual deaf, and (c) postlingual deaf adults. Differences in the evolution of network components across groups as the threshold parameter varies provides insight into differences in structure. It is unclear how one would select a particular threshold which readily reveals these differences without a priori knowledge of their presence. Figure reproduced with permission from (Kim et al. 2014)