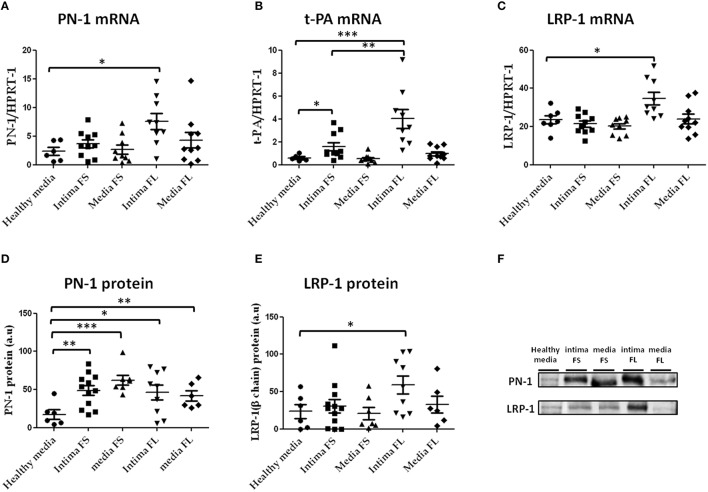
Figure 5.
PN-1 (A), tissue plasminogen activator (t-PA; B), and LRP-1(C) mRNA expression and PN-1 (D, F) and LRP-1 (E, F) protein expression in human aortic tissues (healthy aortas, intima and media of FS, intima and media of FL). PN-1 (A): healthy media n = 6 vs. intima of FL n = 9; *p < 0.05, t-PA (B): healthy media n = 6 vs. intima of FL n = 9; ***p < 0.001, intima of FS n = 10 vs. intima of FL n = 9; **p < 0.01, healthy media: n = 6 vs. intima of FS n = 10; *p < 0.05. LRP-1 (C): healthy media n = 7 vs. intima of FL n = 9; *p < 0.05. PN-1 protein expression (D,F): healthy media n = 6 vs. intima of FS n = 12; **p < 0.01, vs. media of FS n = 7; ***p < 0.001, vs. intima of FL n = 9; *p < 0.05, vs. media of FL n = 6; **p < 0.01. LRP-1 protein (E,F): healthy media n = 6 vs. intima of FL n = 9; *p < 0.05. The non-parametric Mann-Whitney test was used. There was no loading control because intima of advanced lesions is acellular and there are no appropriate stable housekeeping proteins.

