Figure 6.
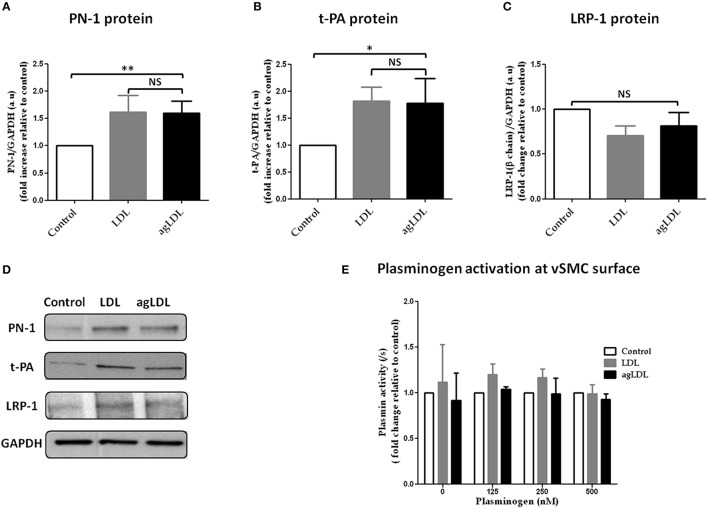
Effects of native and aggregated (ag) LDL on PN-1 (A,D), t-PA (B,D), LRP-1 (C,D) protein expression and plasminogen activation (E) in vSMCs. The results are expressed relative to control for each experiment. PN-1 protein expression (A,D): LDL 1.62 ± 0.30, agLDL 1.60 ± 0.21; **p < 0.01, n = 5. t-PA protein expression (B,D): LDL 1.82 ± 0.26, agLDL 1.78 ± 0.46; *p < 0.05, n = 5. LRP-1 (C,D) protein expression (n = 5). The plasminogen activation (n = 3 and each experiment done in triplicate) at the surface of vSMCs (E). The paired t-test was used.

