Figure 8.
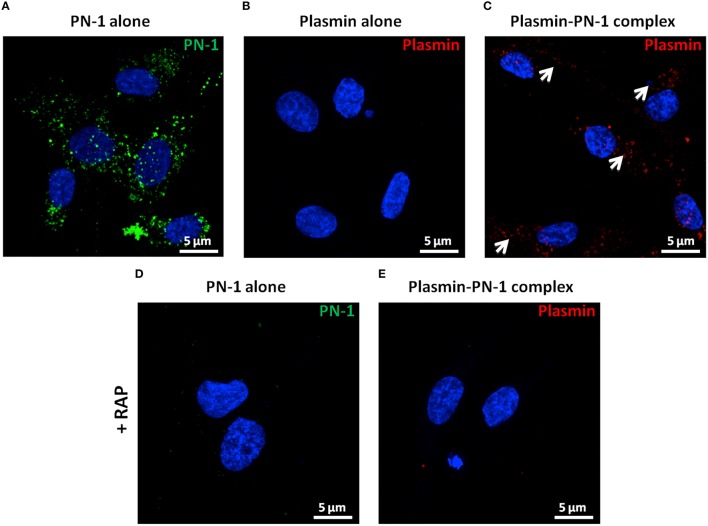
Internalization of PN-1, plasmin, and plasmin-PN-1 complexes in vSMCs (confocal microscopy). PN-1 alone (125 nM, A,D), plasmin alone (25 nM, B), and pre-formed plasmin-PN-1 complexes (C,E) were added to vSMCs for 2 h at 37°C without (A–C) or with RAP (50 μg/ml, D,E). After cell permeabilization, PN-1 alone (A, D) was detected by Alexa Fluor®488-labeled secondary antibody (green), plasmin alone (B) and plasmin-PN-1 complexes (C,E) by Alexa Fluor®555-labeled secondary antibody (red) and nuclei by DAPI staining (blue). White arrows indicate the intracellular localization of plasmin-PN-1 complexes (C). The images are presented as maximum intensity projection of confocal microscopy.

