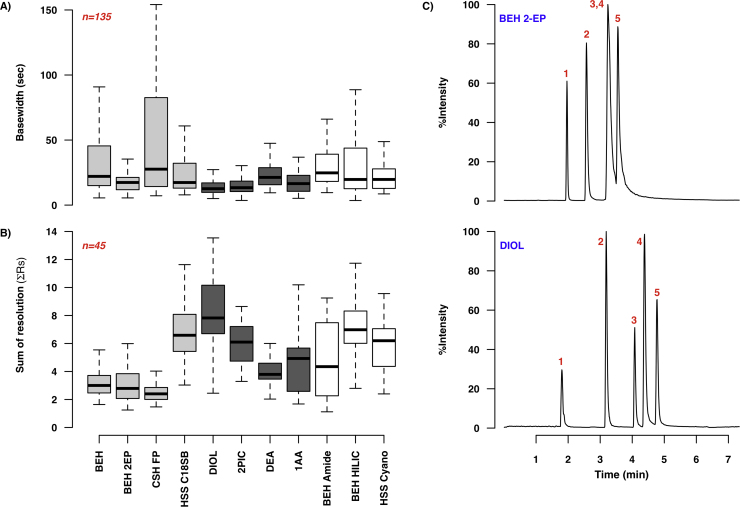
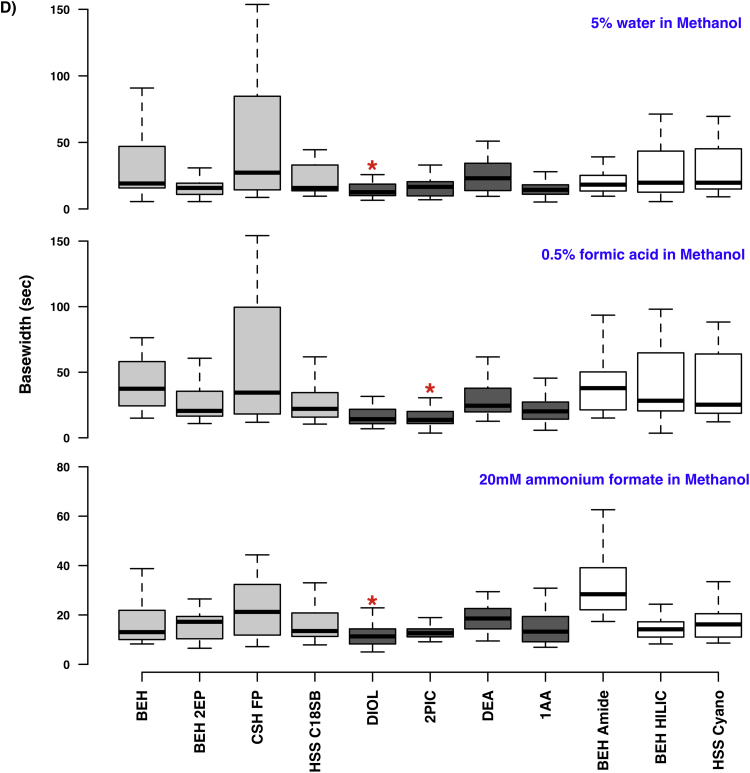
Fig. 5.
Effect of column selection on chromatographic performance in SFC-MS. A shows the variation in peak base widths and B the differences in the sum of resolutions (across water, ammonium formate and formic acid-containing modifiers and all evaluated temperatures) by column. UPC2 columns are in light gray, Torus UPC2 columns are in dark gray and UPLC columns are in white. C illustrates the improvement in separation observed when using a Torus Diol column rather than a BEH 2-EP column. Both TIC chromatograms show separation of the nucleobase test mixture (1:caffeine, 2:uracil, 3:adenosine, 4:cytosine and 5:cytidine) using 20 mM ammonium formate in methanol as a modifier at 40 °C, using the 7.35 min gradient described in Section 2.3.4. D shows the effect of column selection on peak base widths for 3 representative co-solvents, further expanding on the data shown in A; n = 45 for all plots and the red asterisks indicate the lowest median base width value. (For interpretation of the references to colour in this figure legend, the reader is referred to the web version of this article.)


