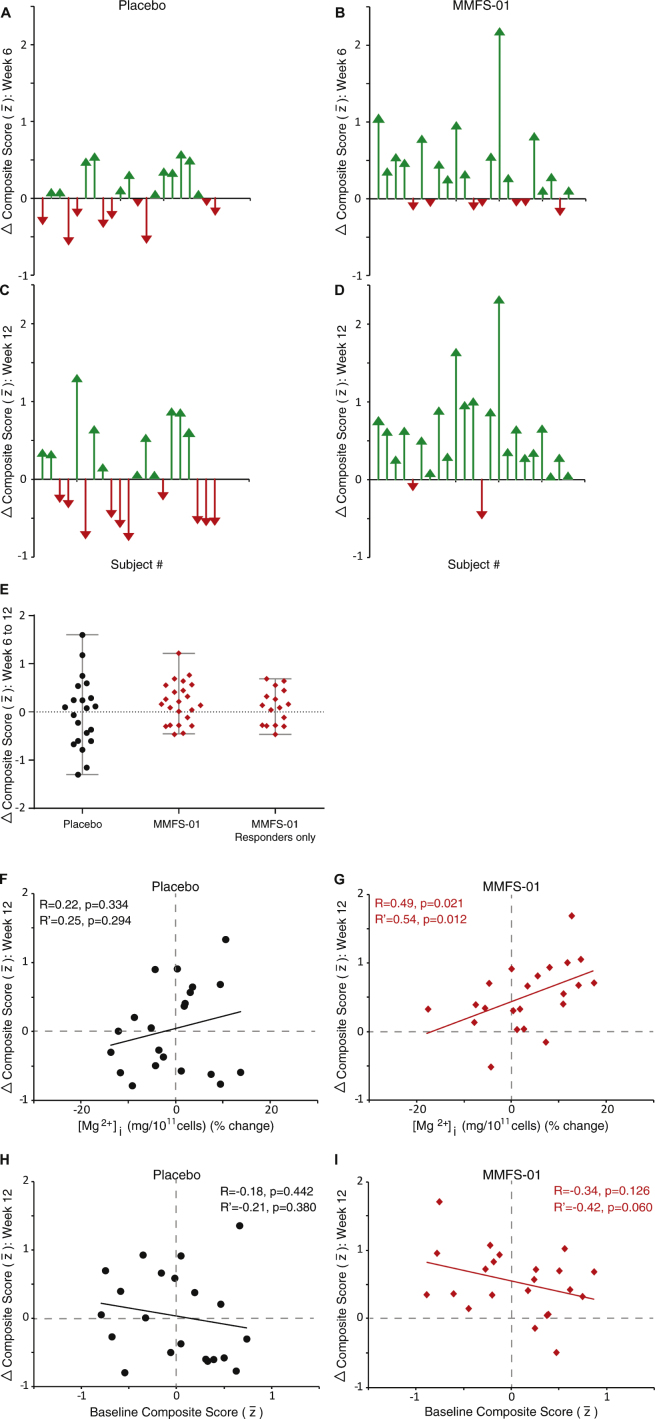
Fig.3.
Analysis of composite score fluctuation. A–D) Individual subject change from baseline composite score at Week 6 and Week 12. Each arrow represents an individual subject, ordered as subject number determined by the order in which each enrolled in the study. Green arrows indicate an increase from baseline in composite score and red arrows indicate a decrease from baseline in composite score. E) Change in composite score from Week 6 to Week 12 for each subject. Bars indicate range of data. Only subjects in the MMFS-01 group who had a positive composite score at Week 6 were included in the “Responders only” group (far right). F, G) Correlations (R) were determined between the percent change of RBC intracellular magnesium concentration and the change from baseline in composite score at Week 12 for placebo treated (F) and MMFS-01 treated (G) subjects. H, I) Correlations (R) were also determined between the baseline composite score and the change from baseline in composite score at Week 12 for placebo treated (H) and MMFS-01 treated (I) subjects. To eliminate contribution to the correlation from other factors, either percent change of RBC intracellular magnesium concentration or baseline composite score was controlled for while calculating each correlation. These correlations (not graphed) are denoted as R’.

