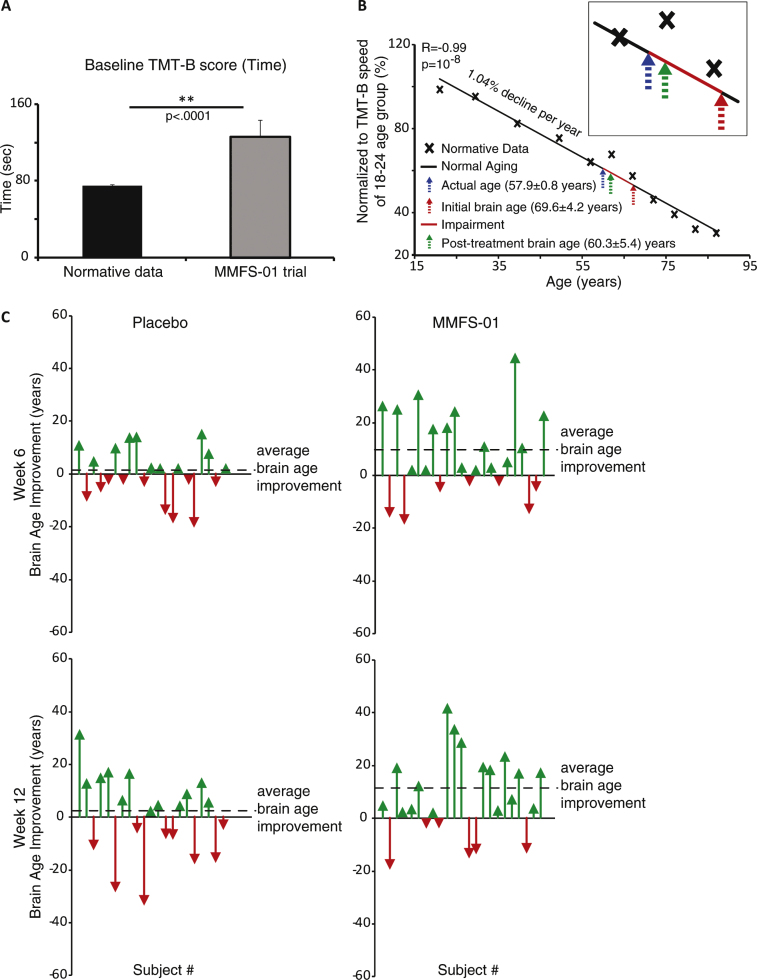
Fig.4.
Reversal of executive function deficits in MMFS-01 treated subjects. A) Average TMT-B time was compared to age-matched normative data [44]. B) Relationship between age and normalized TMT-B speed (percent normalized to peak speed; 100% = 18–24 age group) was graphed from normative data (ages 18–89 separated in 11 different age groups). TMT-B speed declines linearly (R = –0.99, p = 10–8) at a rate of 1.04% per year (black line). Shown on the graph are the location where TMT-B speed corresponds to the average actual age of all subjects in the study (blue arrow), the initial brain age of subjects in the MMFS-01 group (red arrow), and the brain age of subjects following 12 weeks of MMFS-01 treatment (green arrow). The average impairment in brain age of the subjects at the beginning of the trial, relative to age-matched controls from the normative data set, is depicted along the linear trendline (red line). The area of the graph corresponding to the age range of subjects in the study (50–70 years) is enlarged in the inset. C) Change in brain age from baseline for each subject in the MMFS-01 group at Week 6 (top right panel) and Week 12 (bottom right panel) and placebo group at Week 6 (top left panel) and Week 12 (bottom left panel). Each arrow indicates an individual subject, ordered as subject number determined by the order in which each enrolled in the study. Green arrows indicate brain age improvement and red arrows indicate brain age decline relative to baseline. The average brain age improvement is indicated by a dashed line.

