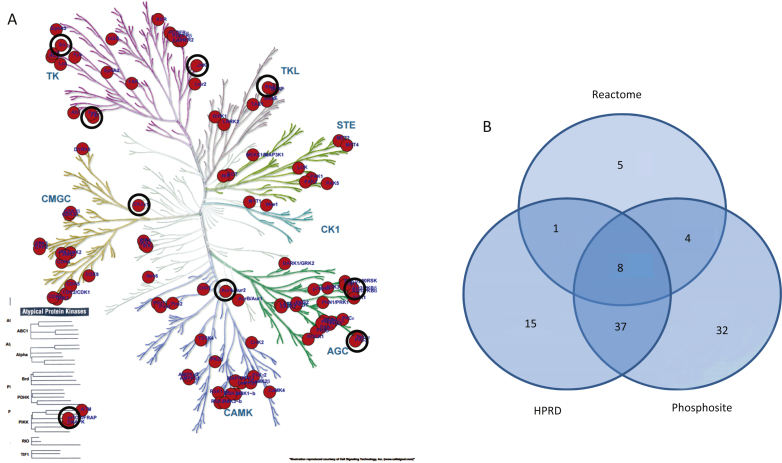
Fig.5.
Phylogenetic tree of the human kinome. Kinases known to differentially phosphorylate phospho-sites present on the PTK and STK PamChip arrays (122 peptides) are projected on the tree. The size of the circle indicates the number of sites phosphorylated (range 1–10). For reasons of visualization, the circle size does not increase with 10+ phosphorylation sites. Black circles indicate upstream kinases presented as highly connected nodes in the STRING analysis (Fig. 3). A) Upstream kinases identified from HPRD, Reactome, or Phosphosite database. B) Venn diagram for the overlap between these databases for the 122 most significantly changed peptides.

