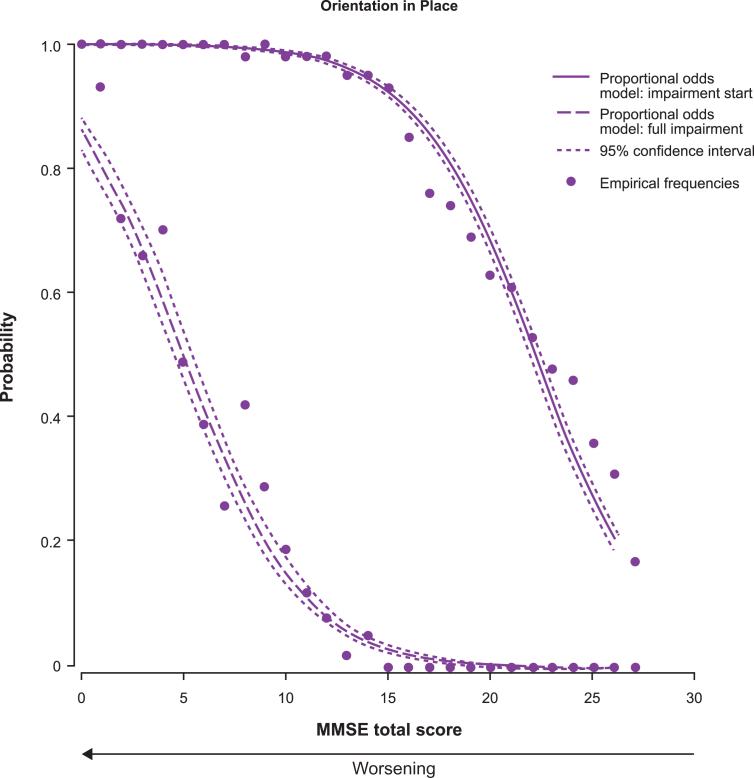
Fig.2.
Proportional odds estimates (and 95% confidence intervals) of impairment start and full impairment for the MMSE subscore of orientation in place as a function of the MMSE total score (n = 1,495). To aid understanding of Figs 3 and 4, this figure gives an example of the data obtained from the POM for one of the MMSE subscores (orientation in place), including the estimated probabilities, 95% CI and empirical frequencies. The right curve is the probability that the subscore is a 1-point decrease from the maximum score (i.e., start of impairment for the patient). The left curve is the probability the subscore is <1 (i.e., patient is fully impaired). To avoid making Fig. 3 and Fig. 4 too complex, they do not include the 95% CI or empirical frequencies.

