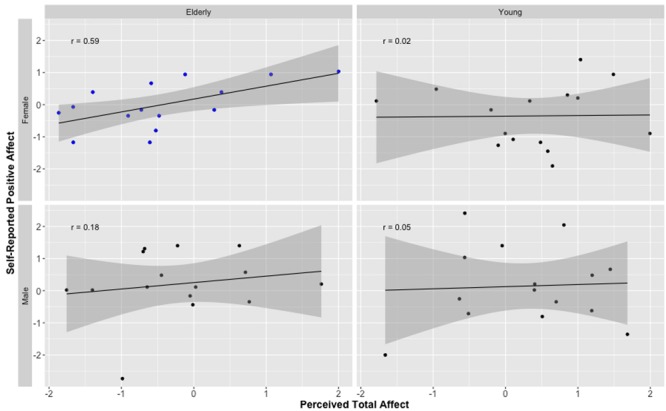
FIGURE 2.

Z-score-transformed correlation coefficients demonstrating the relationship between perceptions of positive affect and self-reported positive affect (from PANAS) for elderly and young male and female faces. r is Pearson correlation. Shaded area represents standard error. Independent ratings of positive affect are the combined ratings of positive affect and the reversed scored ratings of negative affect. Only the correlation for elderly female faces is significant, all other coefficients p > 0.05.
