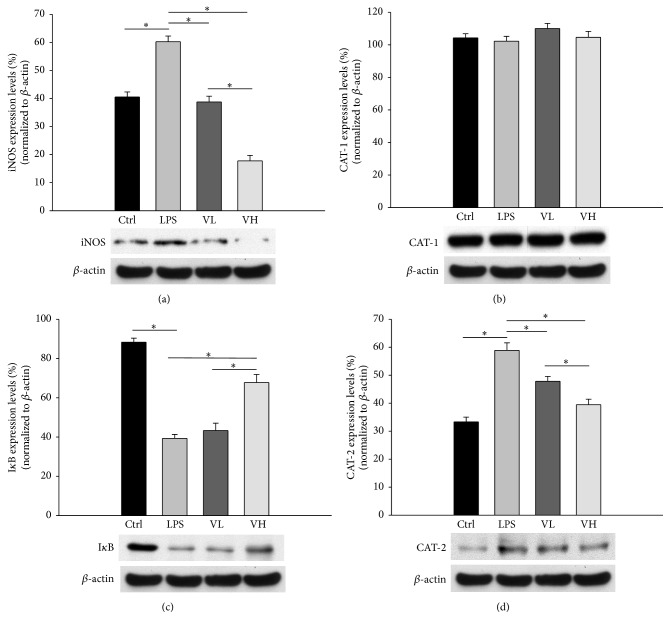
Figure 7.
CAT, iNOS, and IκB protein levels in RAW 264.7 cells. The cells were grouped into control conditions (Ctrl), treatment with LPS (LPS), and pretreatment with 10 nM bortezomib (VL) or 25 nM bortezomib (VH). The protein levels of iNOS, IκB, CAT-1, and CAT-2 were analyzed by western blotting. The symbol “∗” indicates statistical significance.

