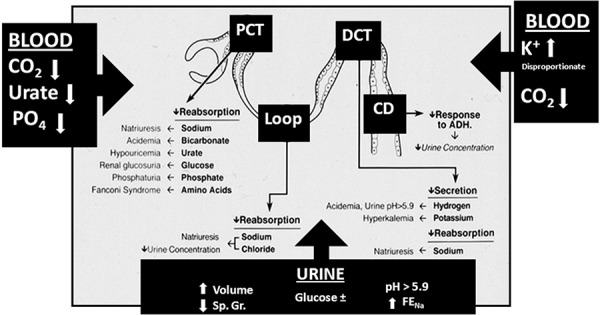
Figure 4. Schematic representation of the sites of tubular dysfunction in acute tubulointerstitial nephritis. The abnormalities in tubular handling of electrolytes are shown in bold lettering and their clinical manifestation in regular lettering. The boxed black arrows indicate the principal changes reflected in blood and urine tests. PCT = proximal convoluted tubule; DCT = distal convoluted tubule; Loop = loop of Henle; CD = collecting duct; Sp. Gr. = specific gravity; FENa = fractional excretion of sodium; PO4 = phosphate; CO2 = carbon dioxide content. (Reproduced with permission from reference number [6]).