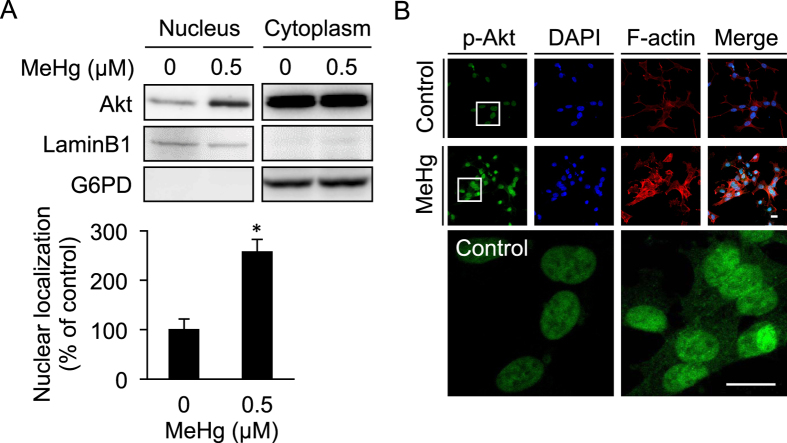
Figure 1. Translocation of phosphorylated Akt in the nucleus.
SH-SY5Y cells were exposed to 0.5 μM of MeHg for 6 h. Nuclear and cytoplasmic fractions were subjected to Western blotting with indicated antibodies. Nuclear Akt band intensity in control was defined as 100%. *p < 0.05 vs. control. Each value is the mean ± S.D. of three determinations (A). The localization of phosphorylated-Akt (p-Akt) (green) was detected along with F-actin (red) and the nucleus (blue). The regions enclosed by the white squares are magnified in the lower panels. Scale bars, 10 μm. (B).

