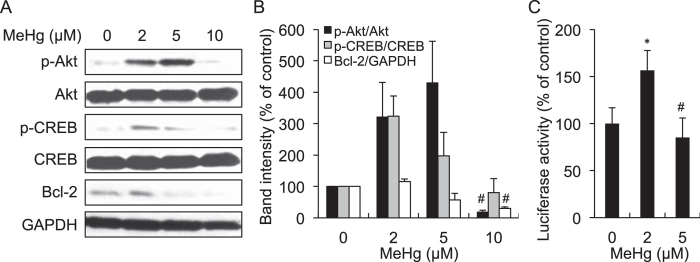
Figure 5. Disruption of Akt/CREB/Bcl-2 signaling by higher concentrations of MeHg in SH-SY5Y cells.
SH-SY5Y cells were exposed to MeHg (0, 2, 5, and 10 μM) for 6 h, and subjected to western blotting (A) and the band intensities were quantified (B). The cells were transfected with CRE-luciferase and exposed to MeHg (0, 2, and 5 μM) for 3 h. The luciferase assay was performed as described in the materials and methods (C). *p < 0.05 vs. control MeHg (0 μM). #p < 0.05 vs. control MeHg (2 μM). Each value is the mean ± S.D. of three determinations.

