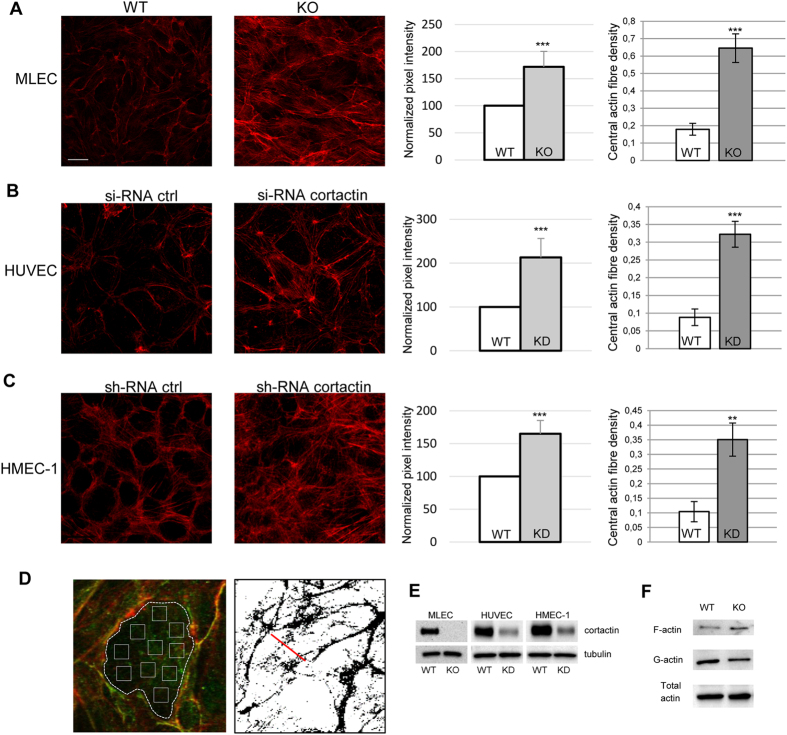
Figure 1. Cortactin depletion results in altered actin morphology in endothelial cells.
Cortactin-deficient murine lung endothelial cells (MLEC, A), cortactin-depleted HUVEC (B) and HMEC-1 (C) were analysed for actin morphology by fluorescence using Alexa568-phalloidin. Images are representative of three independent experiments. Bar = 20 μm. Pixel intensities (graphs on the right) were quantified using ImageJ software. Graphs show means +/−SDM of three independent cultivations. ***p < 0.001. (D) Left: Image illustrating the method of actin fibre quantification as depicted in the left bar charts shown in Fig. 1A–C. Actin staining in red; VE-cadherin staining in green. Right: Illustration of assessment of central actin fibre density28, results of which are shown in the respective right bar charts of Fig. 1A–C. (E) Verification of cortactin depletion or deficiency by Western blot. (F) Analysis of G- vs F-actin levels, and total actin content in lung lysates of WT and cortactin KO mice. Representative blots of three independent experiments are shown.

